Where the 2026 U.S. Open Is Really Driving Short-Term Rental Demand

Overview
The latest booking and revenue data for the 2026 U.S. Open, hosted by the USGA at Shinnecock Hills Golf Club, shows that demand for short-term rental accommodations is most concentrated in markets closest to the course, where bookings and revenue growth are strongest. As distance from the course increases, performance gains appear more modest and are less clearly tied to the event itself.
Across all markets analyzed, Southampton and Hampton Bays stand out as the clearest winners, combining meaningful booking volume with substantial year-over-year revenue growth in accommodations. By contrast, many markets farther from the course show moderate improvements that appear to reflect normal organic demand trends - not directly driven by USGA tournament demand, with limited or inconsistent rate premiums.
1. Southampton & Hampton Bays: The Event Core
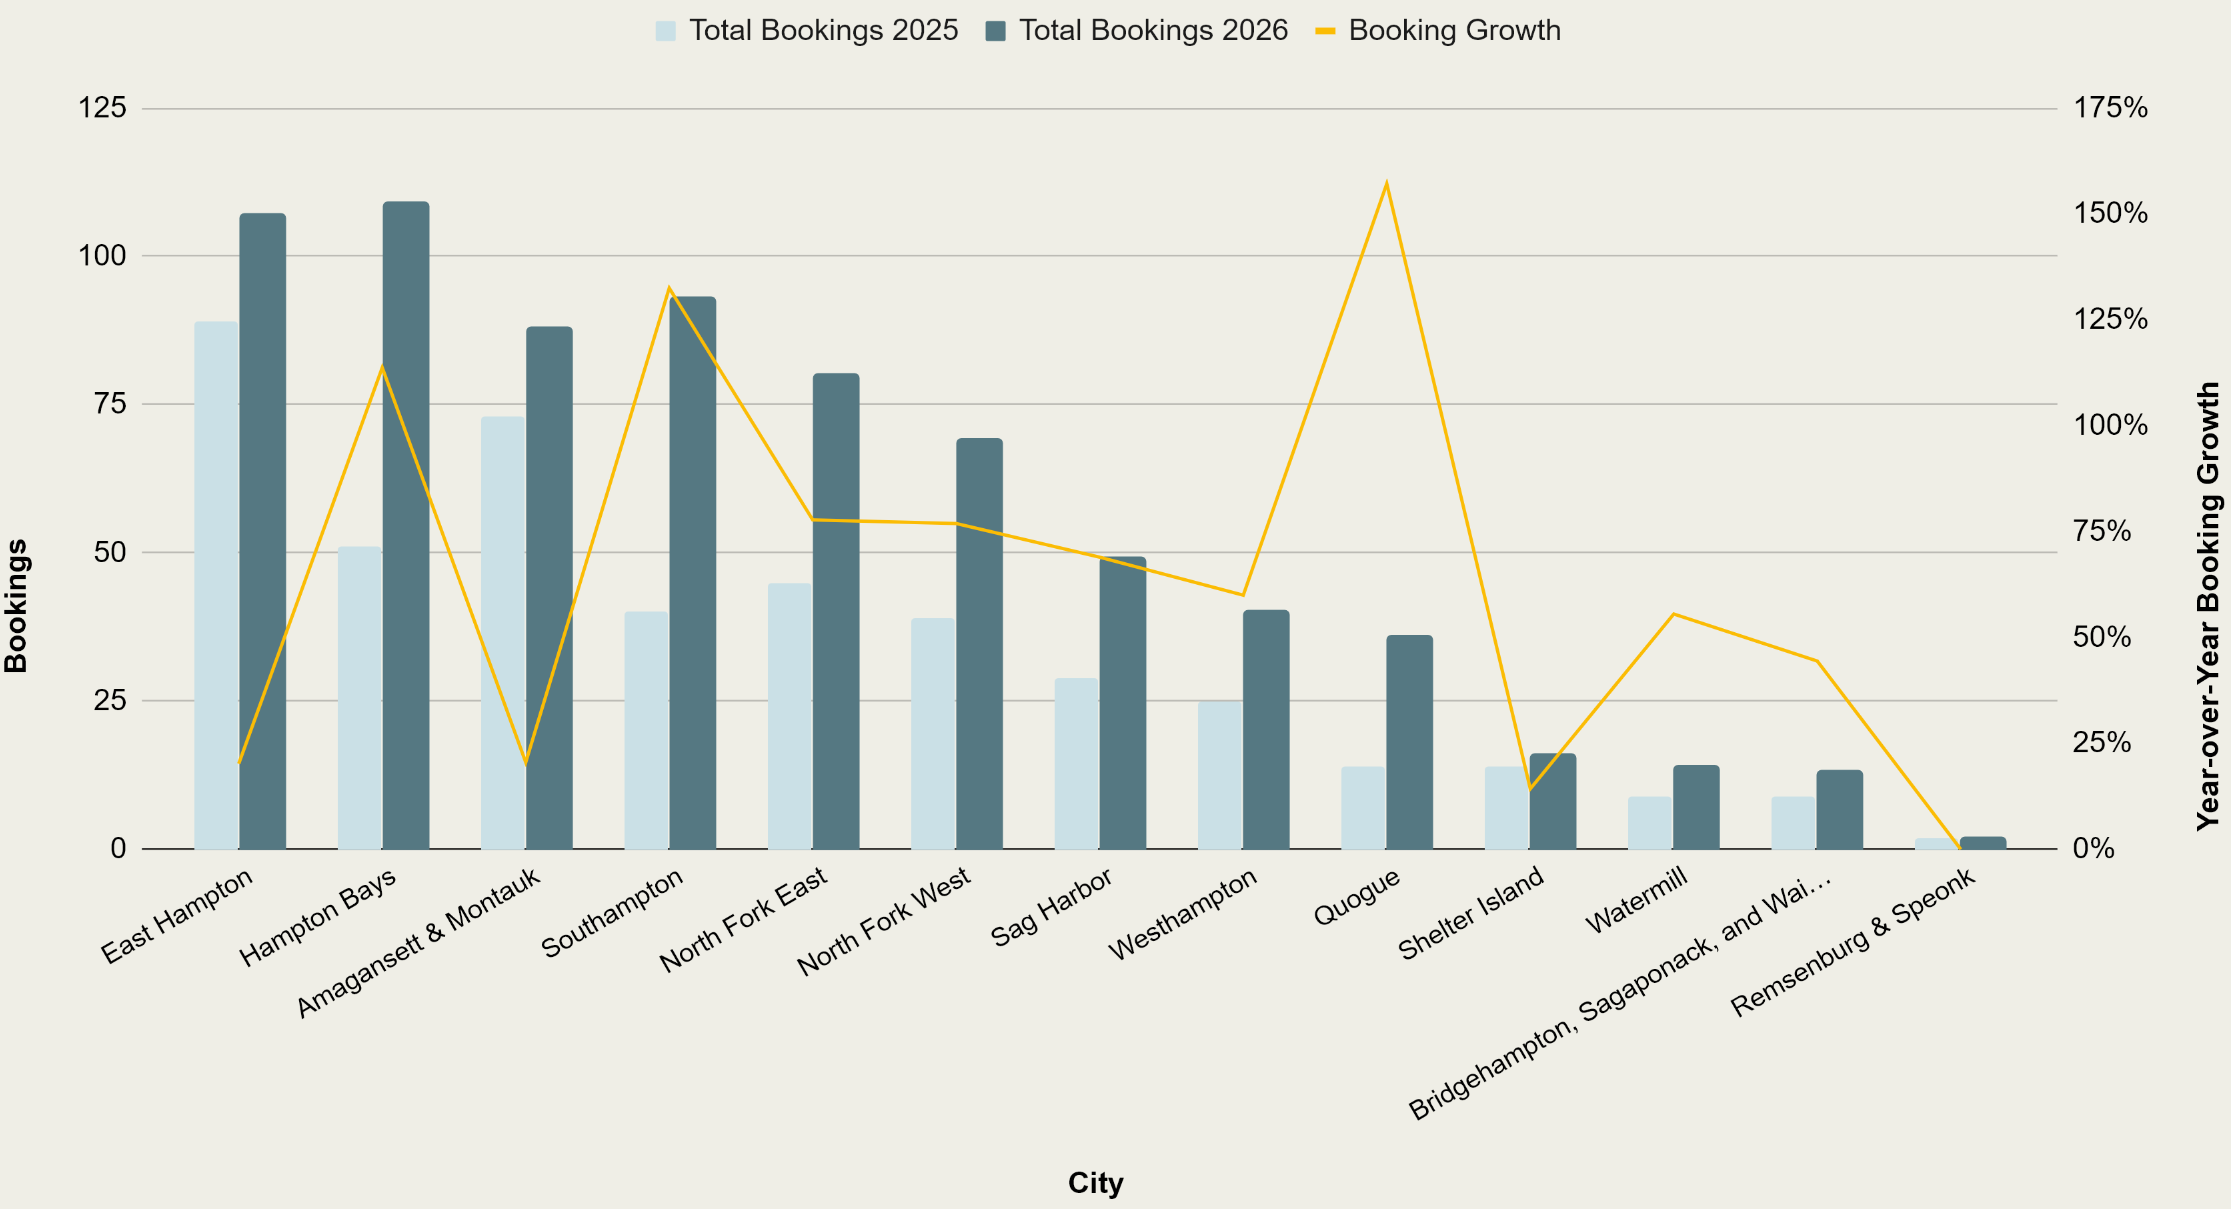
The updated data shows that Southampton and Hampton Bays are among the top markets in both total bookings and growth for the U.S. Open accommodations:
- Both markets more than double bookings year over year, with Southampton's bookings up over 130% and Hampton Bays up over 110%.
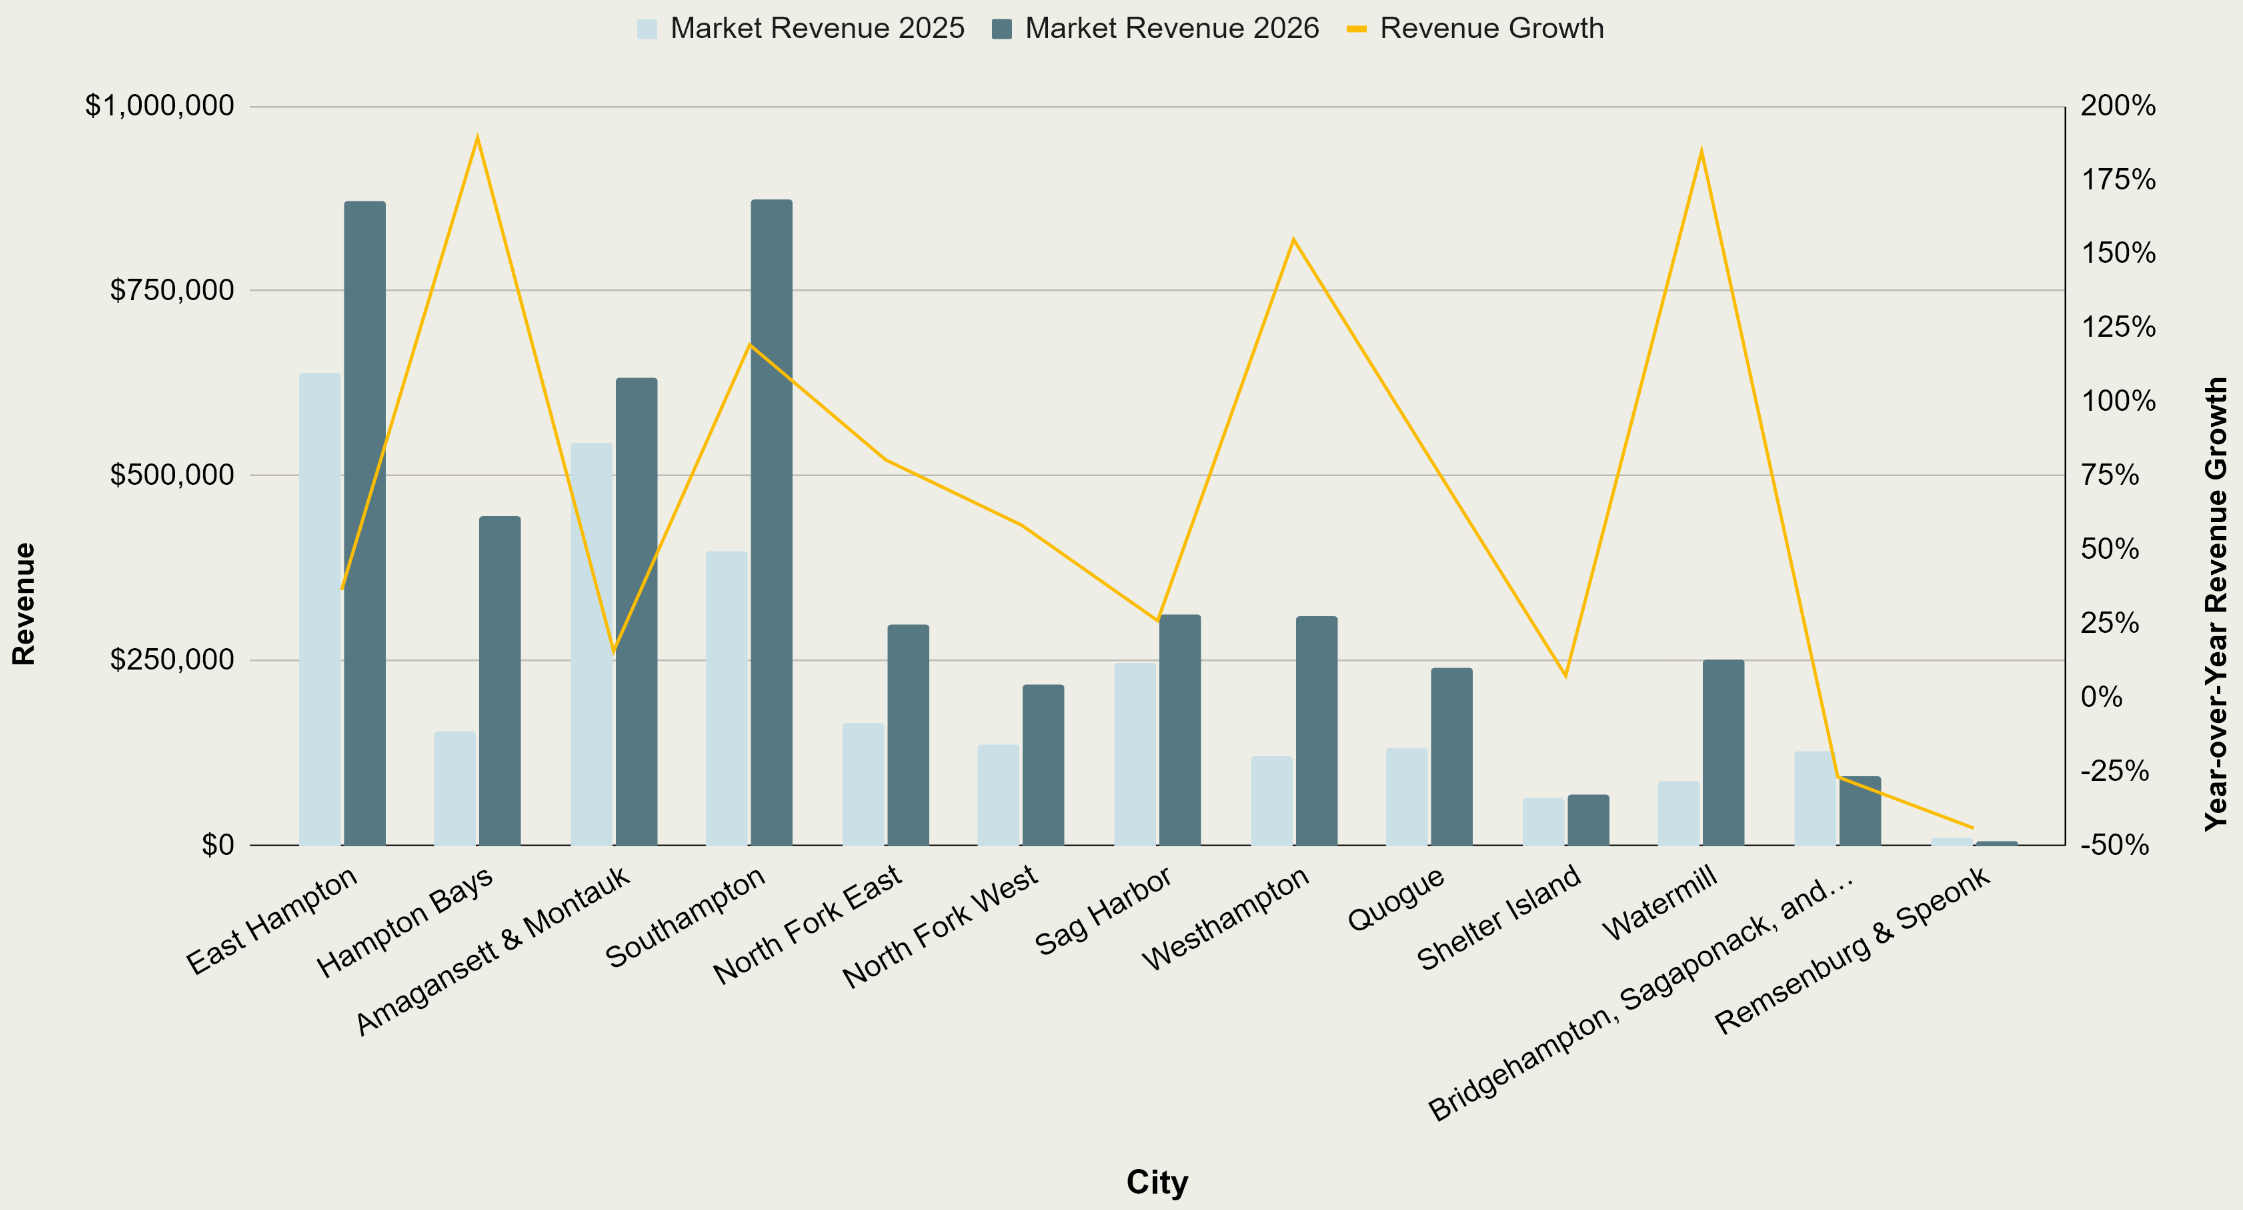
- Market revenue in these two areas surges even more, with triple-digit revenue growth, indicating that higher occupancy, not just higher prices, is driving the performance.
- In the booking and revenue charts for the U.S. Open week, Southampton and Hampton Bays sit near the top of the bar charts and are aligned with some of the steepest year-over-year growth lines.
Total Bookings: U.S. Open Dates 2026
Market Revenue: U.S. Open Dates 2026
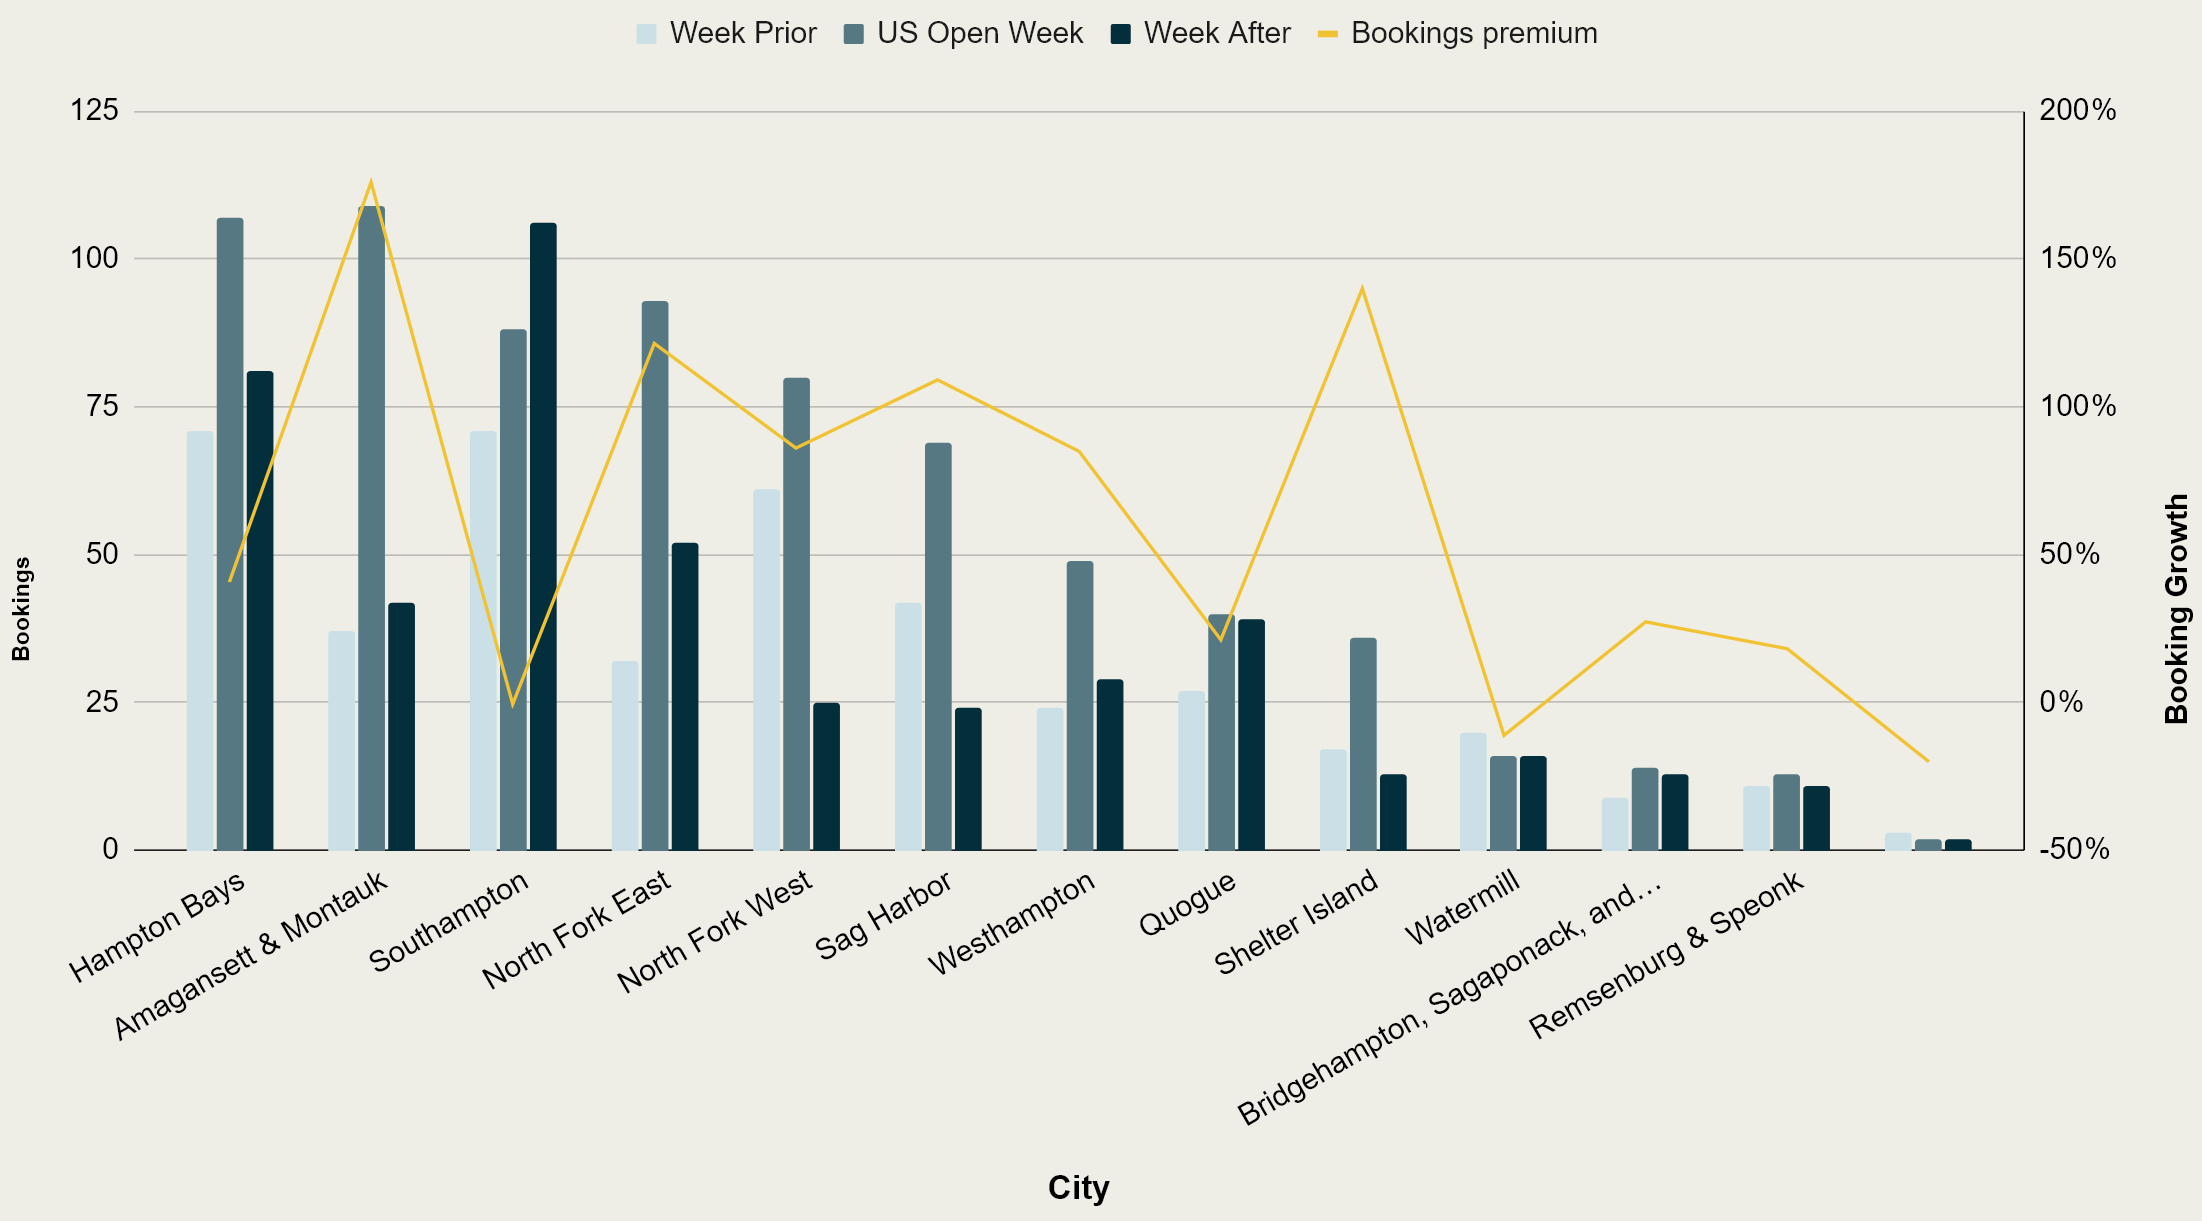
Importantly, when we compare USGA tournament week to the week prior and the week after, both markets gain share during the event window. That suggests these bookings are not just seasonal noise—they are incremental, event-driven stays concentrated around the tournament dates.
2026 U.S. Open Week vs. Week Prior and Week After
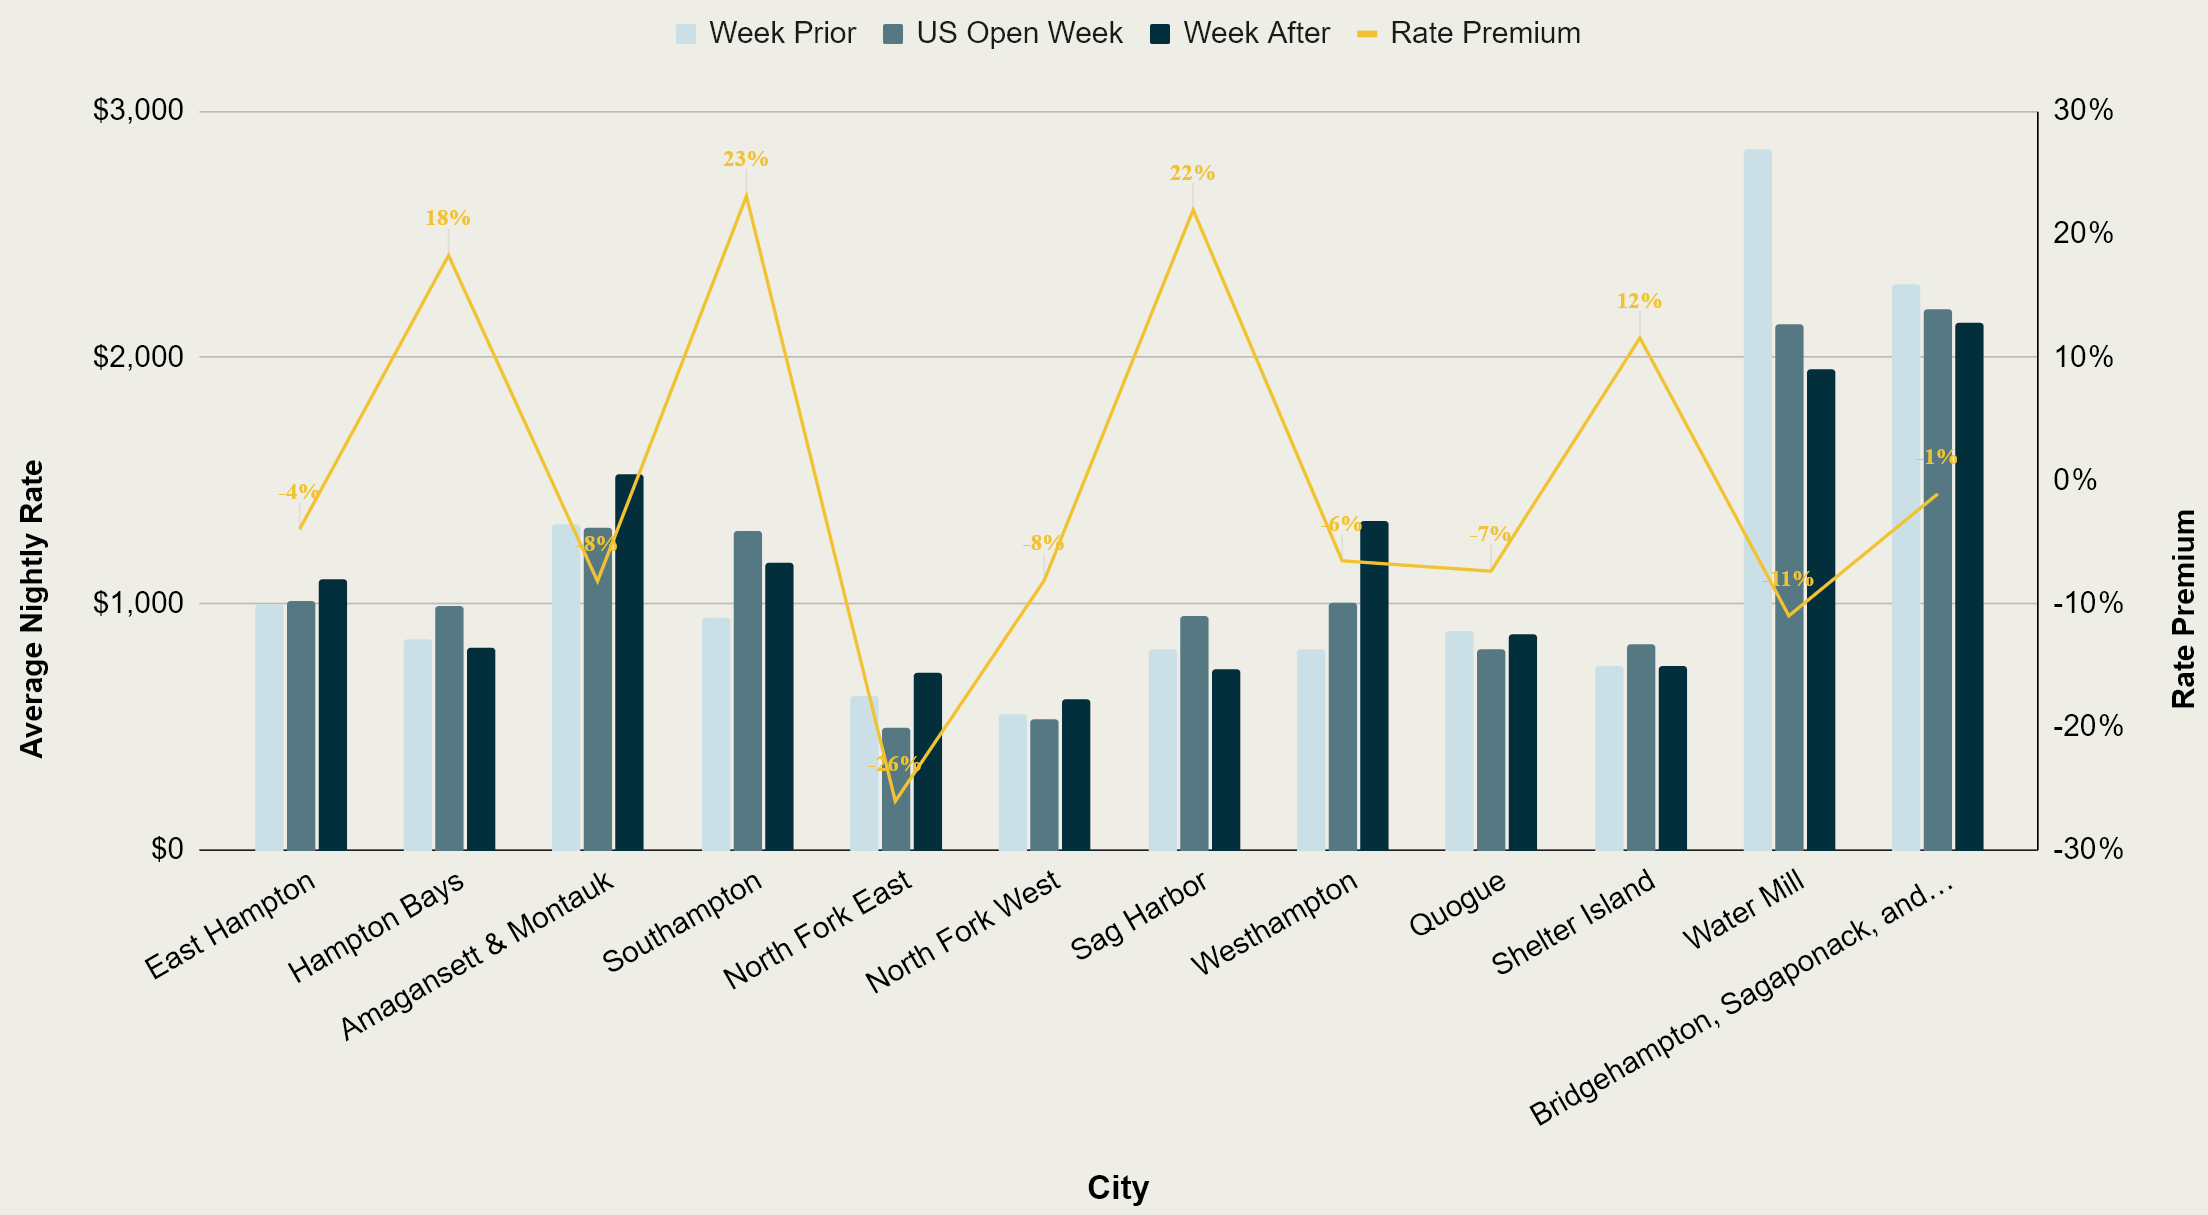
Pricing behavior supports this view:
- Southampton shows healthy booked rates and a modest but positive rate premium for the U.S. Open week compared with surrounding weeks.
- Hampton Bays grows primarily through volume—rates remain broadly in line with its normal pattern, indicating that the opportunity here is to keep occupancy high rather than pushing prices to extreme premium levels.
Together, these signals make Southampton and Hampton Bays the most reliable, event-linked demand centers in the dataset.
2. Strong Baseline Markets vs. True U.S. Open Winners
Markets like East Hampton, Amagansett & Montauk, and the North Fork also show solid bookings and revenue:
- They remain large, healthy markets with strong absolute volume.
- However, their year-over-year growth and rate premiums are more moderate, and the charts show less dramatic market share shift into U.S. Open week vs. the weeks before and after.
2026 U.S. Open Week vs. Week Prior and Week After
In other words, these areas are performing well because they are structurally strong leisure markets, not because they are uniquely capturing U.S. Open spillover. For owners, that means expectations should be framed around steady performance and sensible rate tuning, not outsized event premiums.
3. Outlying Markets: Organic Growth, Limited Pricing Power
Farther from the course—areas such as North Fork West, Westhampton, Shelter Island, Watermill, and Remsenburg & Speonk—we do see:
- Year-over-year increases in bookings and revenue in many cases
- Occasional spikes in rate premiums or booked rates in the charts
But two important caveats apply:
- Sample size: Several of these markets are operating off relatively low booking counts, so a handful of high-priced stays can heavily skew averages and make the growth lines look more dramatic than the underlying opportunity really is.
- Limited event signal: The market share and week-prior/week-after views show that these areas do not consistently gain share during the U.S. Open week. That suggests that most of the uplift is organic and seasonal, not directly tied to the event—and rate premiums in these areas are often modest or even negative.
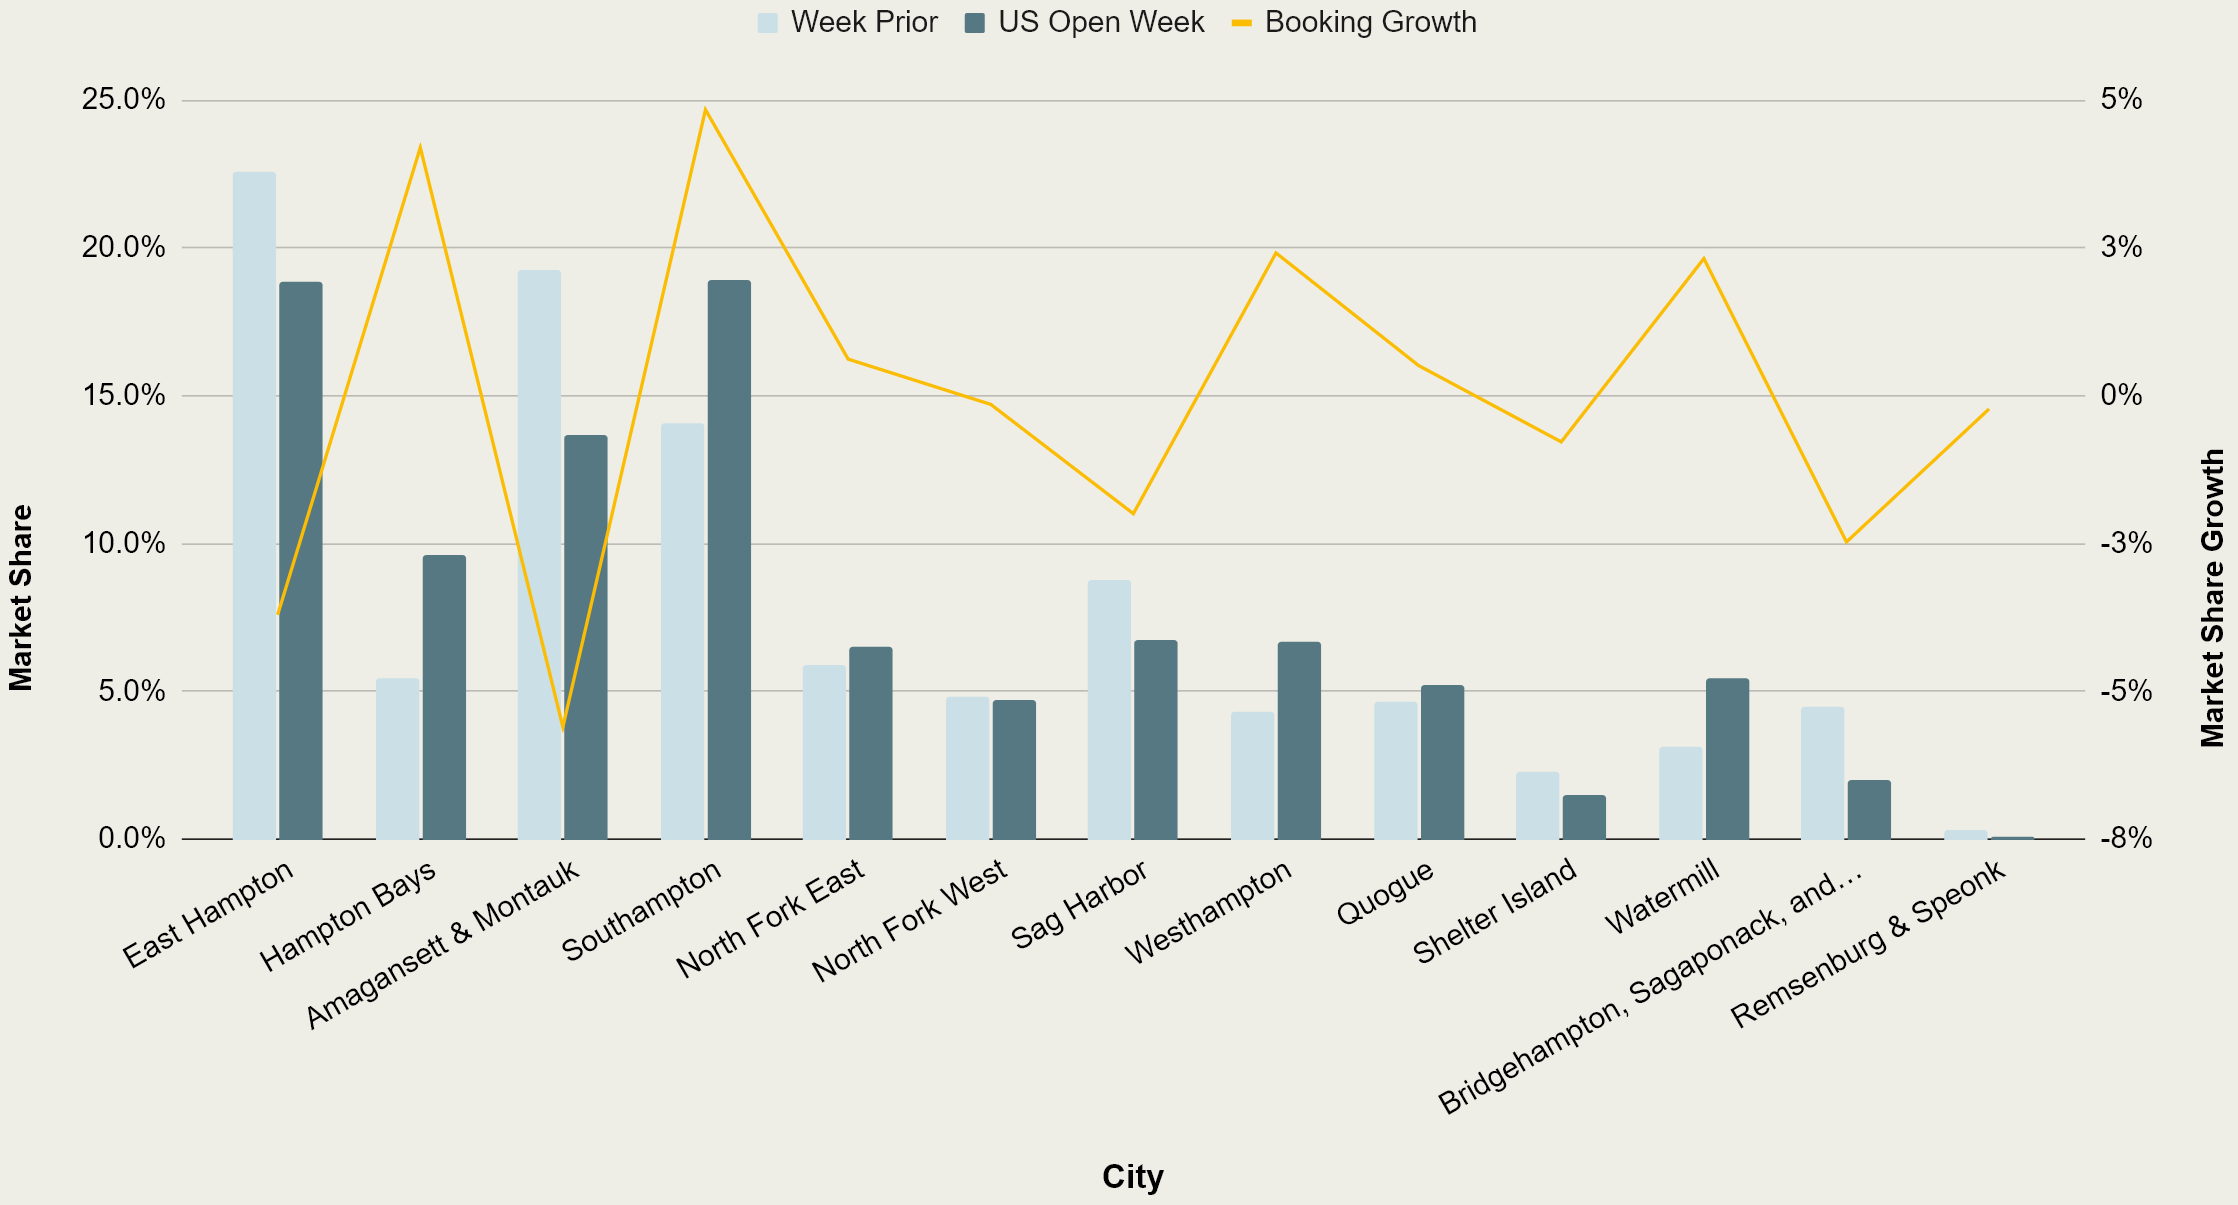
2026 U.S. Open: Market Share by City
For owners in these locations, it would be risky to assume U.S. Open guests will pay sustained premium rates simply because the tournament is happening in the region.
4. Implications for Pricing & Positioning
For Southampton and Hampton Bays:
- Lean into event-week pricing, with measured rate premiums supported by strong demand and clear share gains.
- Focus on availability and minimum-stay strategies to capture high-value bookings over the full tournament window, with potential for increased rate premiums on shorter lengths of stay.
For other nearby markets:
- Treat the U.S. Open as a demand tailwind, not a guaranteed windfall.
- Use data-driven, incremental rate adjustments, and avoid overpricing based on a few standout bookings in small markets.
- Emphasize the area's usual strengths—beach, summer leisure, and local attractions—rather than relying solely on the U.S. Open narrative.
Conclusion
The latest data reinforces a simple but critical message:
The USGA's U.S. Open's impact on accommodations is highly localized.
- Southampton and Hampton Bays are where the event is clearly concentrating demand and revenue.
- Other markets are doing well, but their gains are best understood as organic growth with limited, uneven rate premium tied to the event.
Setting owner expectations around this reality will help avoid overpricing, protect occupancy, and ensure that any upside from the U.S. Open is captured strategically and sustainably, rather than based on misleading outliers.