Has Halloween scared away renters?

COVID sent The Hamptons rental market into a frenzy over the last few years, driving demand later into the year than ever before. Before COVID, owners celebrated “Tumbleweed Tuesday” - the first Tuesday after Labor Day when seasonal summer renters would return to their full-time residences, allowing many local to the Hamptons to breath a deep sigh of relief. During the 2020 and 2021 off-seasons, however, renters remained in the Hamptons throughout the year. With this boom in off-season demand came an influx in rental inventory, as owners who had previously not rented their properties in the offseason aimed to capitalize on the financial opportunity their neighbors were benefitting from. This off-season, with the (at least partial) return to the office and schools fully open, that demand has subsided to 2019 levels, but the inventory remains - posing a challenge for owners who had expected strong earnings in the period after Labor Day.
Off-season demand has fallen by double digits across all metrics as renter behavior returns to pre-pandemic norms. Increased comfort traveling via plane has allowed renters to travel to other, more traditional, winter markets during this period. As a result, Gross Booking Value, the number of bookings and the number of nights booked are all down ~10% year-over-year in 2022 for the period between Labor Day through end of the year.
| Year | Gross Booking Value (Growth %) | # of Bookings (Growth %) | # of Nights Booked (Growth %) |
|---|---|---|---|
| 2019 | -- | -- | -- |
| 2020 | 48% | 10% | 32% |
| 2021 | -3% | 0% | -9% |
| 2022 (Estimate) | -8% | -14% | -12% |
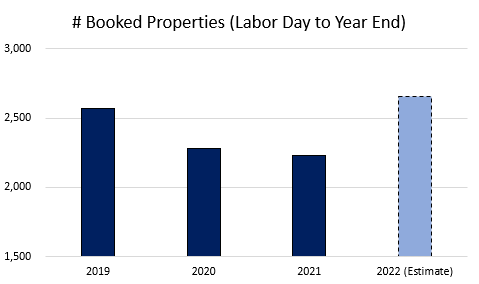
More inventory translates to more competition. In 2022, renters have more rental options to choose from than any of the prior three years. The number of properties that have 1 or more bookings during the off-season has already surpassed 2020 and 2021 and we expect that number to climb beyond 2019 levels.
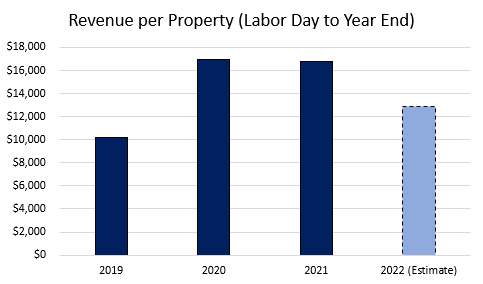
More competition ultimately results in lower revenue per property. In a highly competitive rental environment, the best tactic for obtaining bookings - outside of making home improvements or reducing minimum stay restrictions - is lowering price. With Gross Booking Value falling and the number of booked properties rising, revenue per property is expected to fall below 2020 and 2021 levels for the post-Labor Day period in 2022.
Renters pay more for properties when they book further in advance. Average nightly rate for bookings with a check-in post-Labor Day decreases with less lead time. Each year since 2018, renters paid more per night when booking in Q1 through Q3 than they did in Q4. Because rates are lower closer to a check-in date, setting up availability earlier provides the best opportunity for the highest dollar bookings.
| Nightly Rate | ||||||
|---|---|---|---|---|---|---|
| Check in Year >>> | 2018 | 2019 | 2020 | 2021 | 2022 | |
|
Booked
Quarter |
Q1 | 894 | 772 | 920 | 918 | 922 |
| Q2 | 978 | 746 | 813 | 939 | 958 | |
| Q3 | 855 | 768 | 861 | 893 | 934 | |
| Q4 | 784 | 630 | 759 | 818 | TBD | |
Pricing varies widely by month, not just by peak season vs. offseason. Winter rates are significantly lower than spring and fall rates. The same property that may book for $1,000 per night in the summer should price as low as $225 per night in the winter in order to secure bookings.
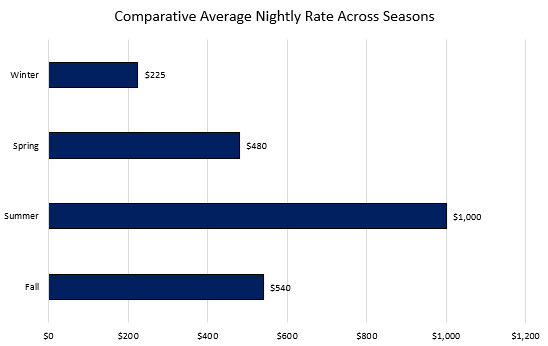
Off-season holidays provide an opportunity for higher occupancy but be careful not to charge too large of a nightly premium. The nightly price premium for holidays that occur after Labor Day like Thanksgiving, Christmas and New Years, is ~10% . By comparison, the rates broken out by season shown above suggest that summer nights are worth 300%+ more than winter nights.
| Year | Thanksgiving, Christmas, and NYE Nightly Premium |
|---|---|
| 2019 | 6% |
| 2020 | 1% |
| 2021 | 11% |
| 2022 (Estimate) | 6% |
Lastly, properties that showcase holiday decorations in the listing have a 40%+ higher chance of obtaining a rental for the holidays. If you would like to decorate your home for the holiday season, and capture professional photography to be used for your listing, let us know and we will connect you with Arthur Golabek, our preferred vendor. See some of our recent holiday decoration projects below:


Have questions or want to learn how to best market your property in the off-season? Email us at owner@staymarquis.com at call/text at 631-301-2960.
Max is the Chief Revenue Officer at StayMarquis and a rental pricing and strategy expert. In his role, Max oversees strategic advisory for 500+ properties across all markets that StayMarquis is active in, owns development and ongoing improvement of the patent pending StayMarquis Pricing Analytics Dashboard (PAD), and leads market research. Prior to joining StayMarquis, Max lived in the strategy consulting world, where he worked closely with chief executives across industries and geographies. He graduated from Emory University with degrees in Finance, Analytic Consulting, and Applied Mathematics.