2022 Hamptons Rental Market Report
The following report analyzes the 2022 rental market in the Hamptons, as well as our future expectations based on the current micro and macroeconomic environment. We see the following trends playing out in 2023:
- Slowing Demand - Slowing Hamptons rentals as the US dollar strengthens, demand to flight-time destinations continue, and fears of a recession loom. Off-season demand reverts to pre-pandemic levels.
- Increased competition - Inventory growing at a rapid pace making it more challenging for owners to attract renters. “Class A” properties (the top tier homes) will continue to perform well throughout the year; however, “Class B” and “Class C” will realize a dip in occupancy and average nightly rental rates, especially during the off-season.
- Heightened guest expectations - The maturing vacation rental market pushes hosts to 'keep up with the Jones'. Owners must reinvest in their properties and improve the experience they deliver to their guests. We found one of the best financing options here.
Market Overview
Hamptons rentals between Memorial Day and Labor Day in 2022 could be summarized by strong demand paired with increased supply, which resulted in the highest Gross Booking Value (“GBV”) since 2019, eclipsing 2019 GBV by $15M. The 2022 rental season closer resembled 2019 than it did the previous two years, pointing to a post-pandemic state and a return to semi-normalcy. Rental demand continued throughout the peak season with total GBV increasing 18.8% year-over-year to $151M, while average nightly rates across the market increased slightly by 0.6% to $1,268.
Booking volume, in terms of number of bookings, increased 36.5% in 2022 compared to 2021, but length of stay decreased to just under five nights per booking, even shorter than pre-pandemic levels. Average booking value dropped by over 13.0% year-over-year to $6,226 in 2022, signifying renters' sensitivity to total ticket size and, as a result, preference for shorter durations. Furthermore, inventory grew by 20.4% as homeowners, especially those who bought during the pandemic, hoped to take advantage of the vacation rental market boom and monetize their newly owned assets. As such, the average revenue per property fell by 1.3%. As more properties enter the rental market and the macroeconomic environment remains unsteady, we suspect the average revenue per property will continue to fall, with “commodity” product bearing the brunt of declines.
| 2019 MDW-LDW |
2020 MDW-LDW |
2021 MDW-LDW |
2022 MDW-LDW |
|
|---|---|---|---|---|
| # Bookings /Growth |
25,188 |
16,617 (34.0%) |
17,828 7.3% |
24,340 36.5% |
| Gross Booking Value ($) /Growth |
$136,861,458 |
$116,114,407 (15.2%) |
$127,512,036 9.8% |
$151,537,491 18.8% |
| # Nights Booked /Growth |
139,470 |
109,319 (21.6%) |
101,215 (7.4%) |
119,528 18.1% |
| Avg. Booking Value ($) /Growth |
$5,434 |
$6,988 28.6% |
$7,152 2.4% |
$6,226 (13.0%) |
| Avg. Rate / Nt /Growth |
$981 |
$1,062 8.2% |
$1,260 18.6% |
$1,268 0.6% |
| # Properties Booked /Growth |
4,449 |
3,079 (30.8%) |
3,314 7.6% |
3,989 20.4% |
| Revenue / Property /Growth |
$30,762 |
$37,712 22.6% |
$38,477 2.0% |
$37,989 (1.3%) |
| Nights Booked / Property /Growth |
31 |
36 13.3% |
31 (14.0%) |
30 (1.9%) |
| Avg. Duration of Stay (#Nights) /Growth |
5.5 |
6.6 18.8% |
5.7 (13.7%) |
4.9 (13.5%) |
Rental Demand
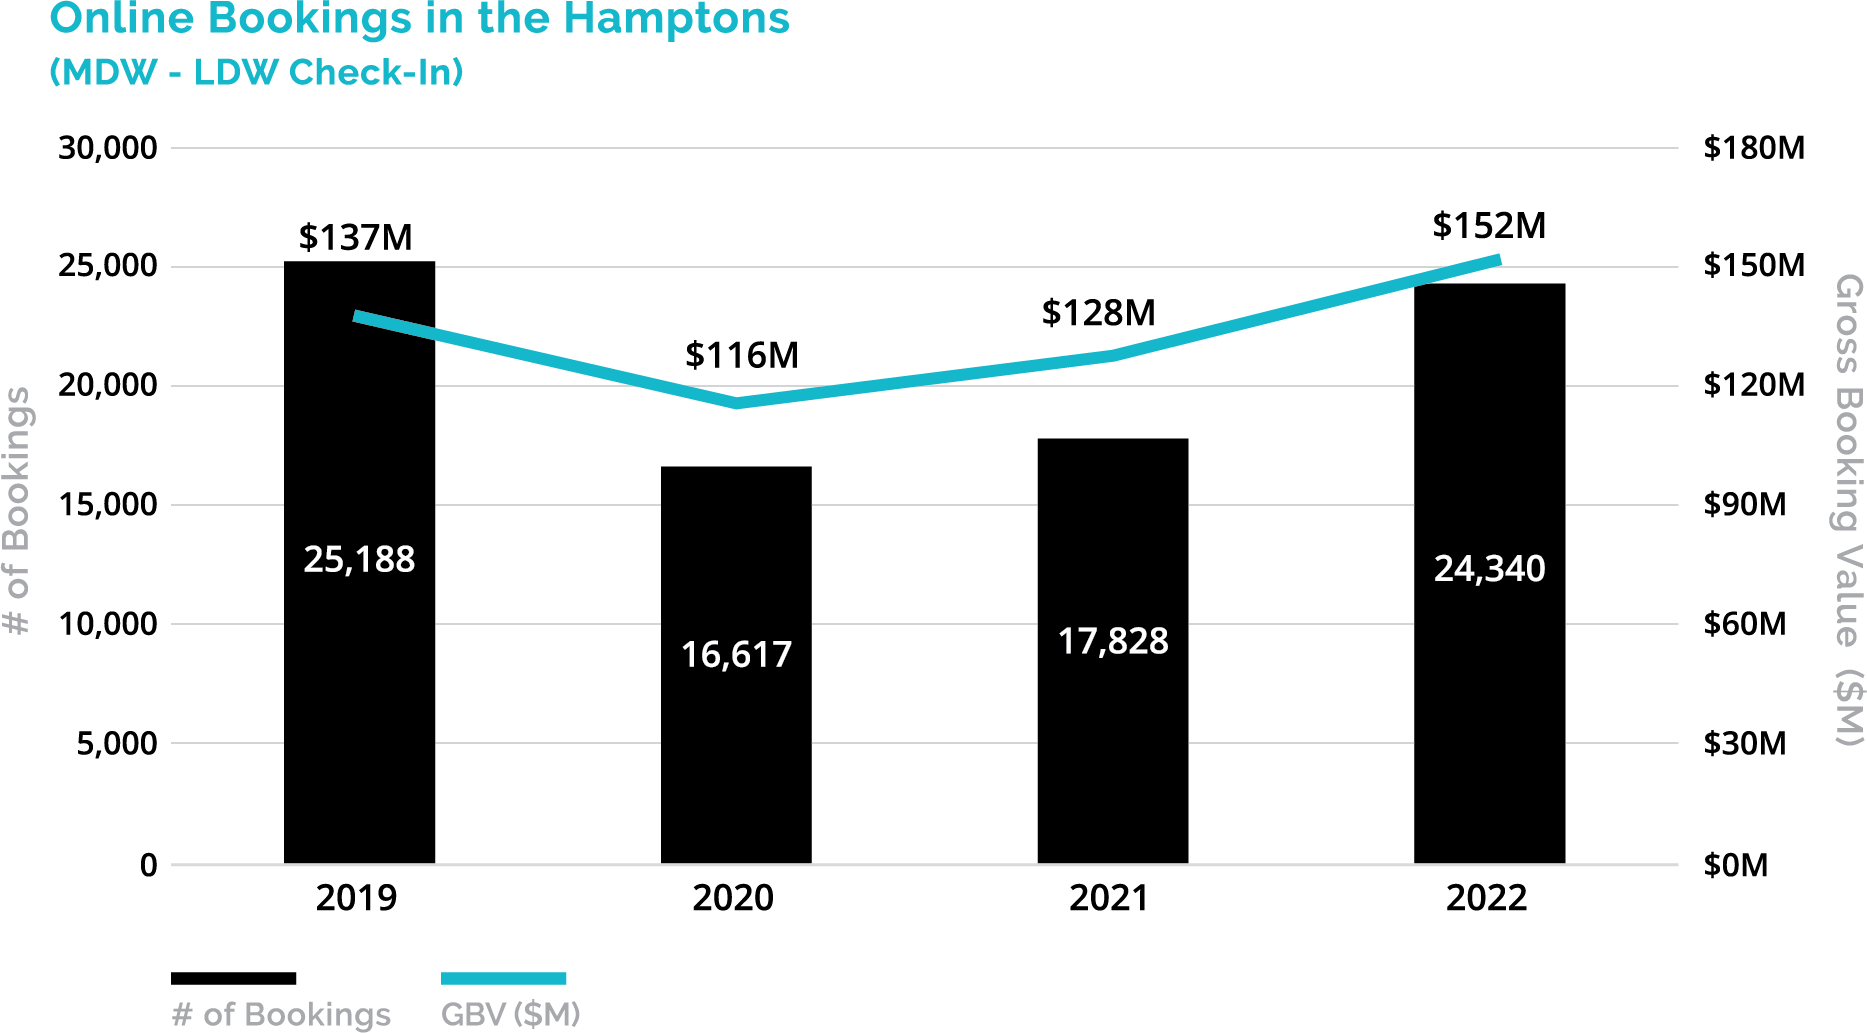
The graph below reflects the number of online bookings and GBV between Memorial Day and Labor Day broken out by year from 2019 through 2022. We expect the online rental market to continue its growth into 2023, taking away market share from the traditional brokerage community, especially as average durations of stay remain short.
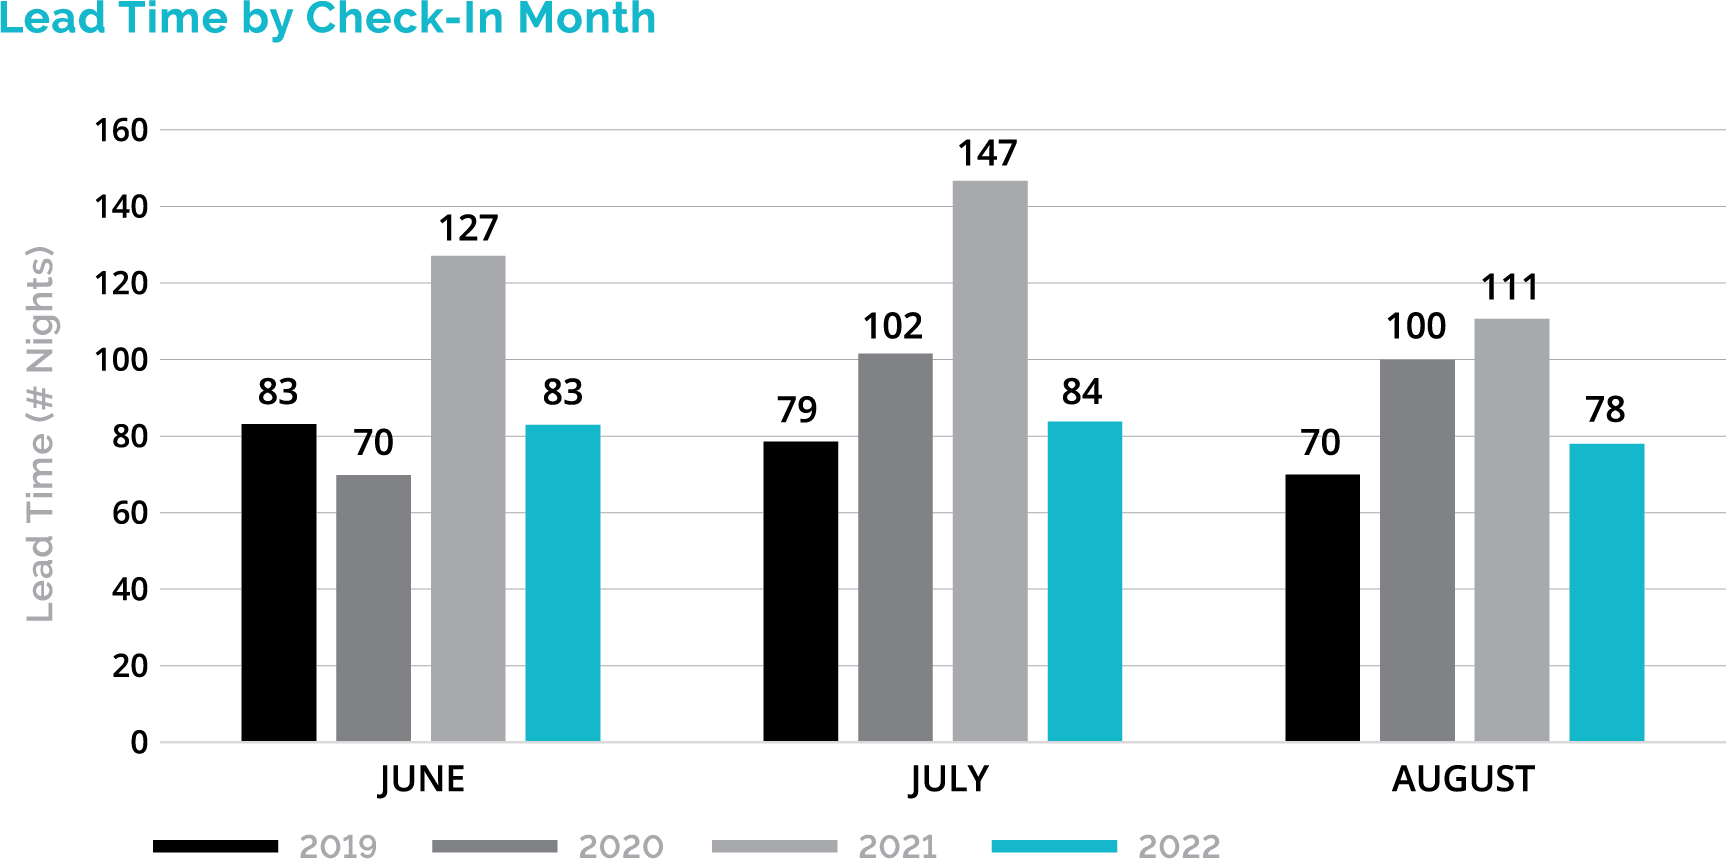
As we saw in 2019, lead time - the number of days a renter books a property before check-in - fell significantly in 2022. During COVID, many owners removed their properties from the rental market, causing renters to search and book their properties earlier on in the year. With rising inventory in a post-COVID world, renters have many more options to choose from, giving them confidence to wait longer to reserve their vacation home. This is very similar to booking behavior in 2019, and we suspect that 2023 will follow suit.
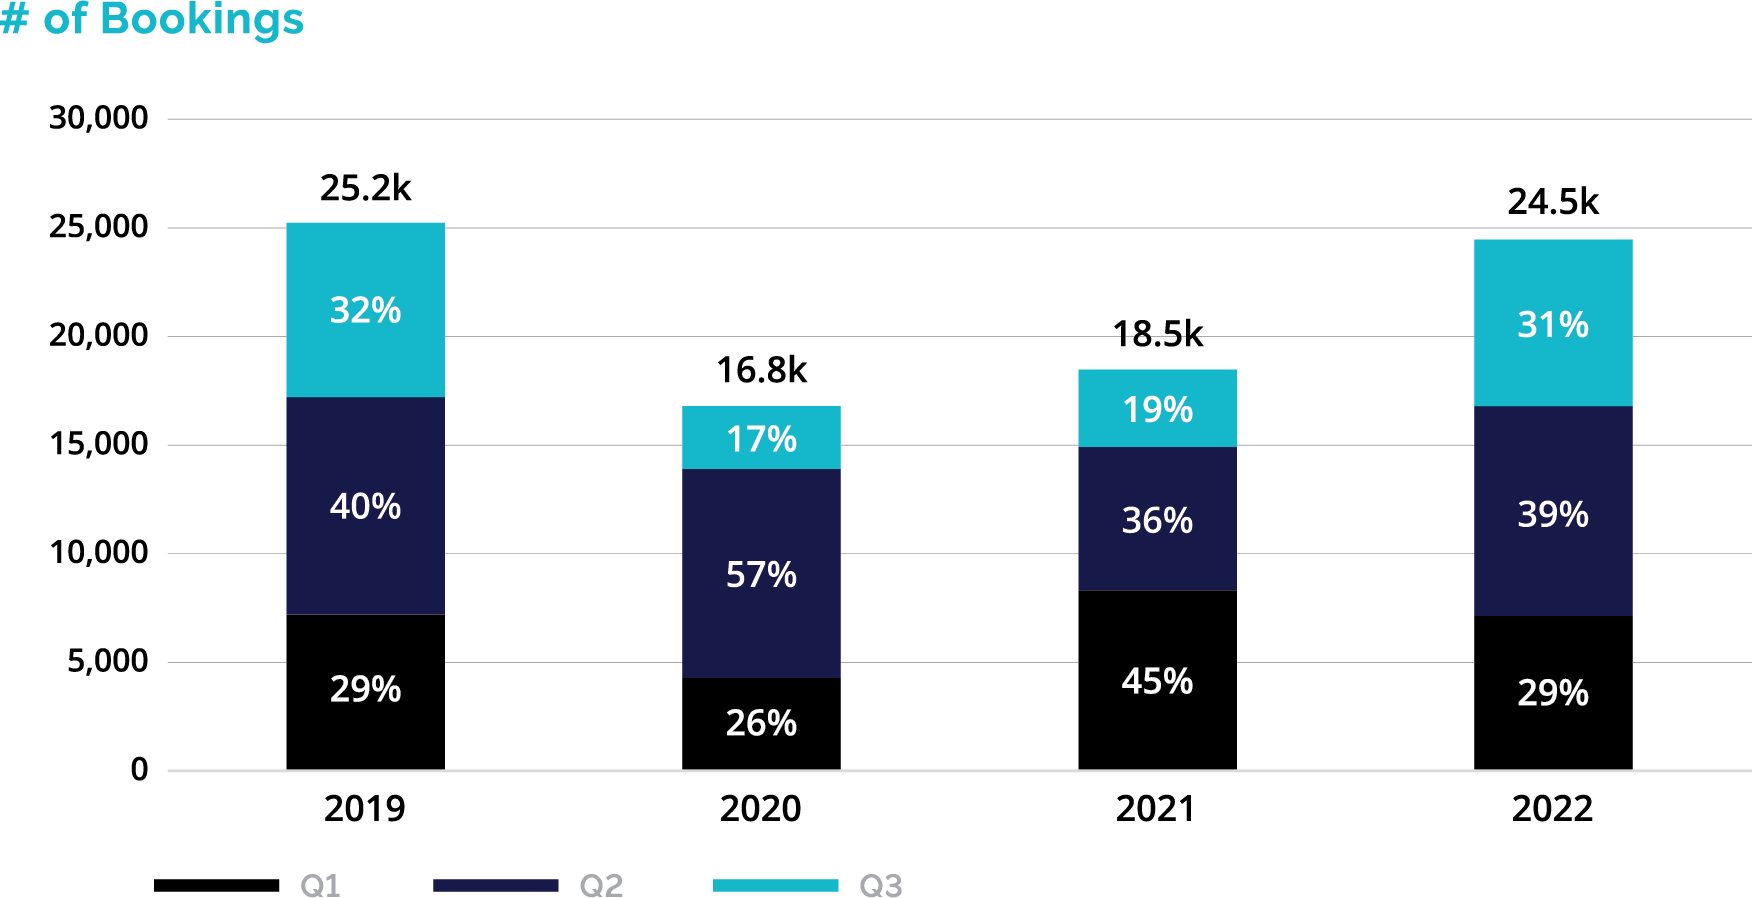
In both 2019 and 2022, the percentage of bookings made in Q1 and Q3 were approximately equal. In 2020, however, there was a clear shift in activity where most bookings took place in Q2 – almost immediately following COVID-related shutdown announcements in the tri-state area. In 2021, booking activity was focused in Q1, as renters looked to lock in their plans earlier in the year, following the strong booking momentum from the end of 2020.
Changes in the macroeconomic environment are strongly correlated to booking activity and have driven demand trends over time. The image below shows that as treasury rates increase, booking activity slows down. This slow down signifies renter fear of a potential recession, impacting travel decisions, though it appears to be an ephemeral sentiment as renters continued to book heading into the peak season of 2022. Similarly, the beginning of the war in Ukraine in February appeared to have only caused a blip in rental activity. As rates continued to rise throughout the summer of 2022, booking activity sharply dropped off. The 78.1% decline in monthly booking spend from June to September 2022 is the largest since March 2020.
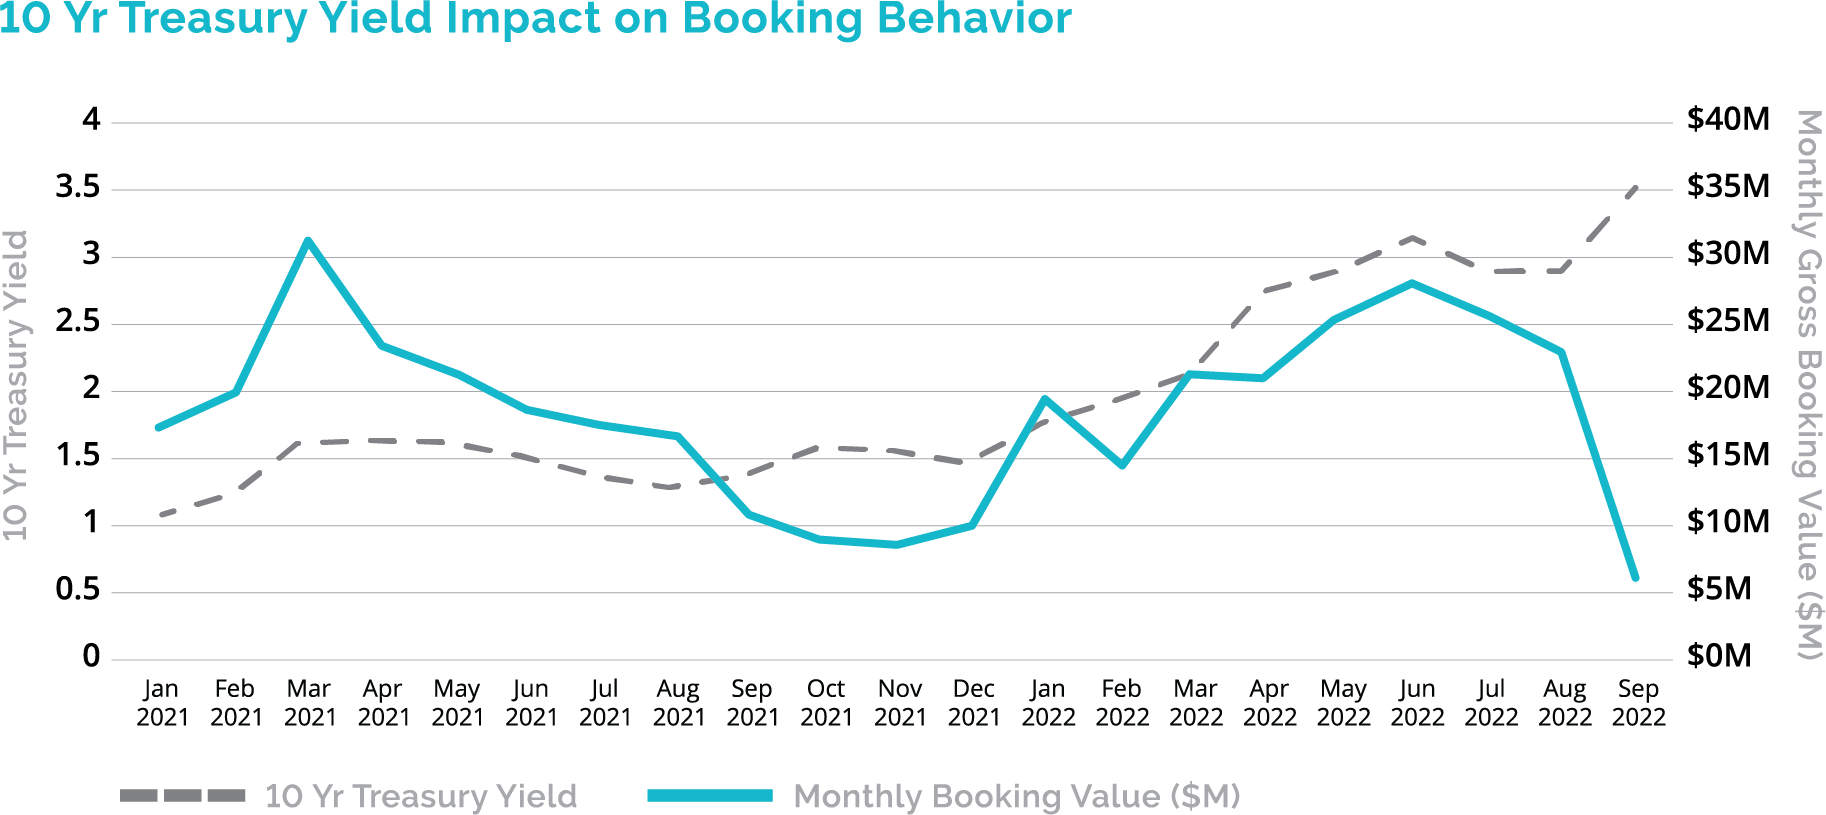
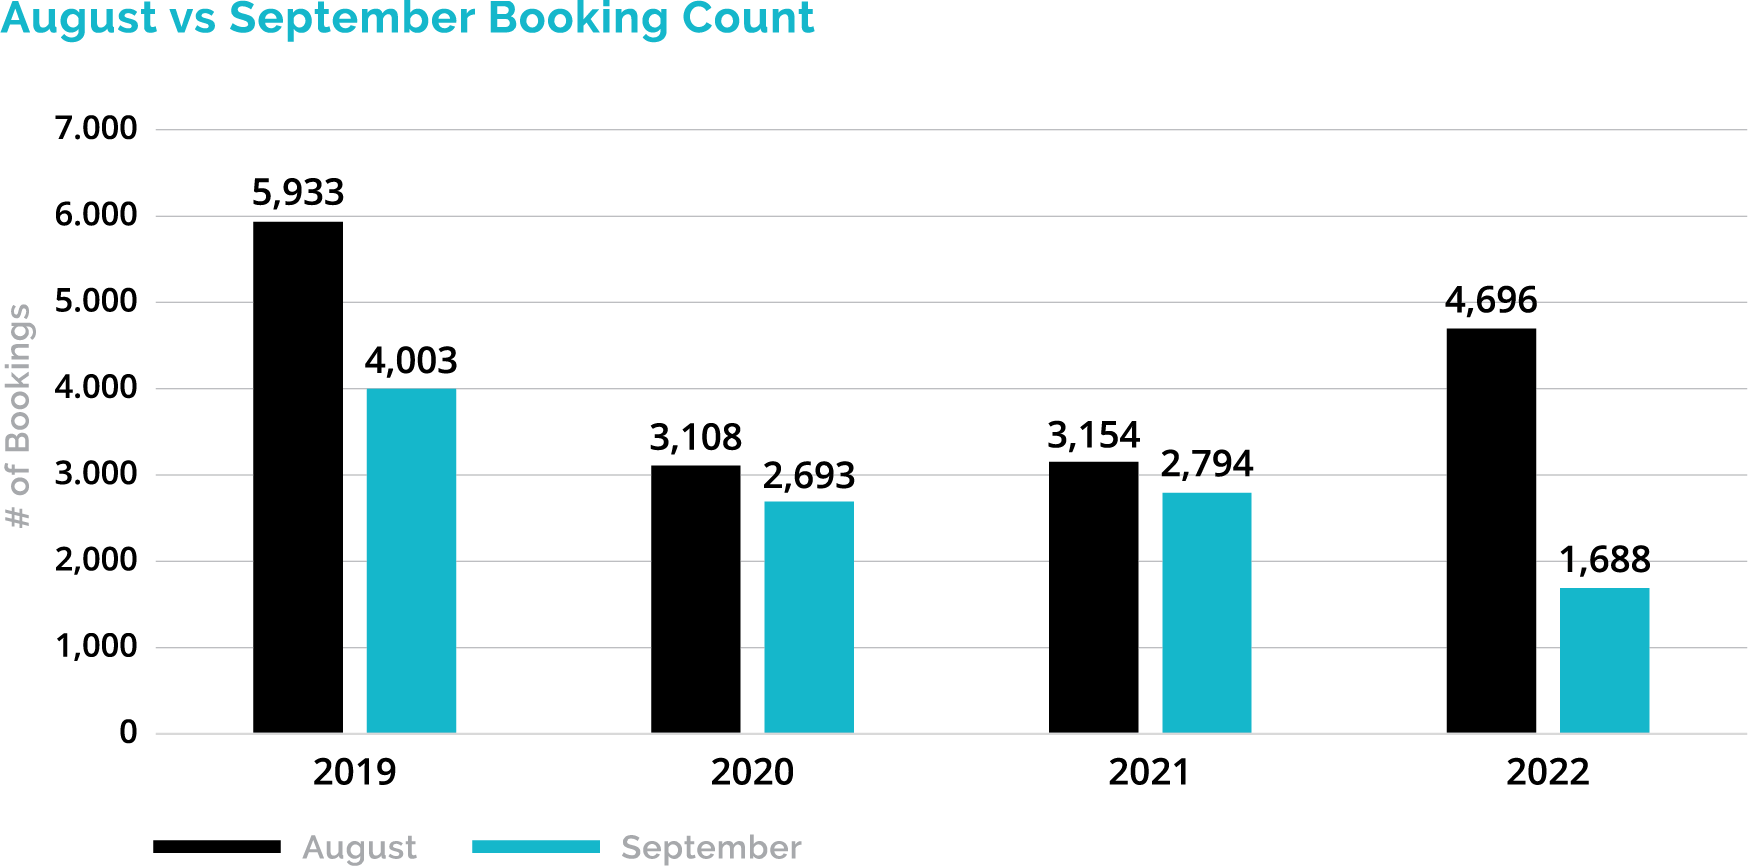
This drastic slowdown in activity year-over-year was due to a combination of price sensitivity and booking volume. Historically speaking, September typically has at least 67.5% of the number of bookings as August. In 2022, however, September only had 35.9% of the number of bookings as August.
Rental Supply
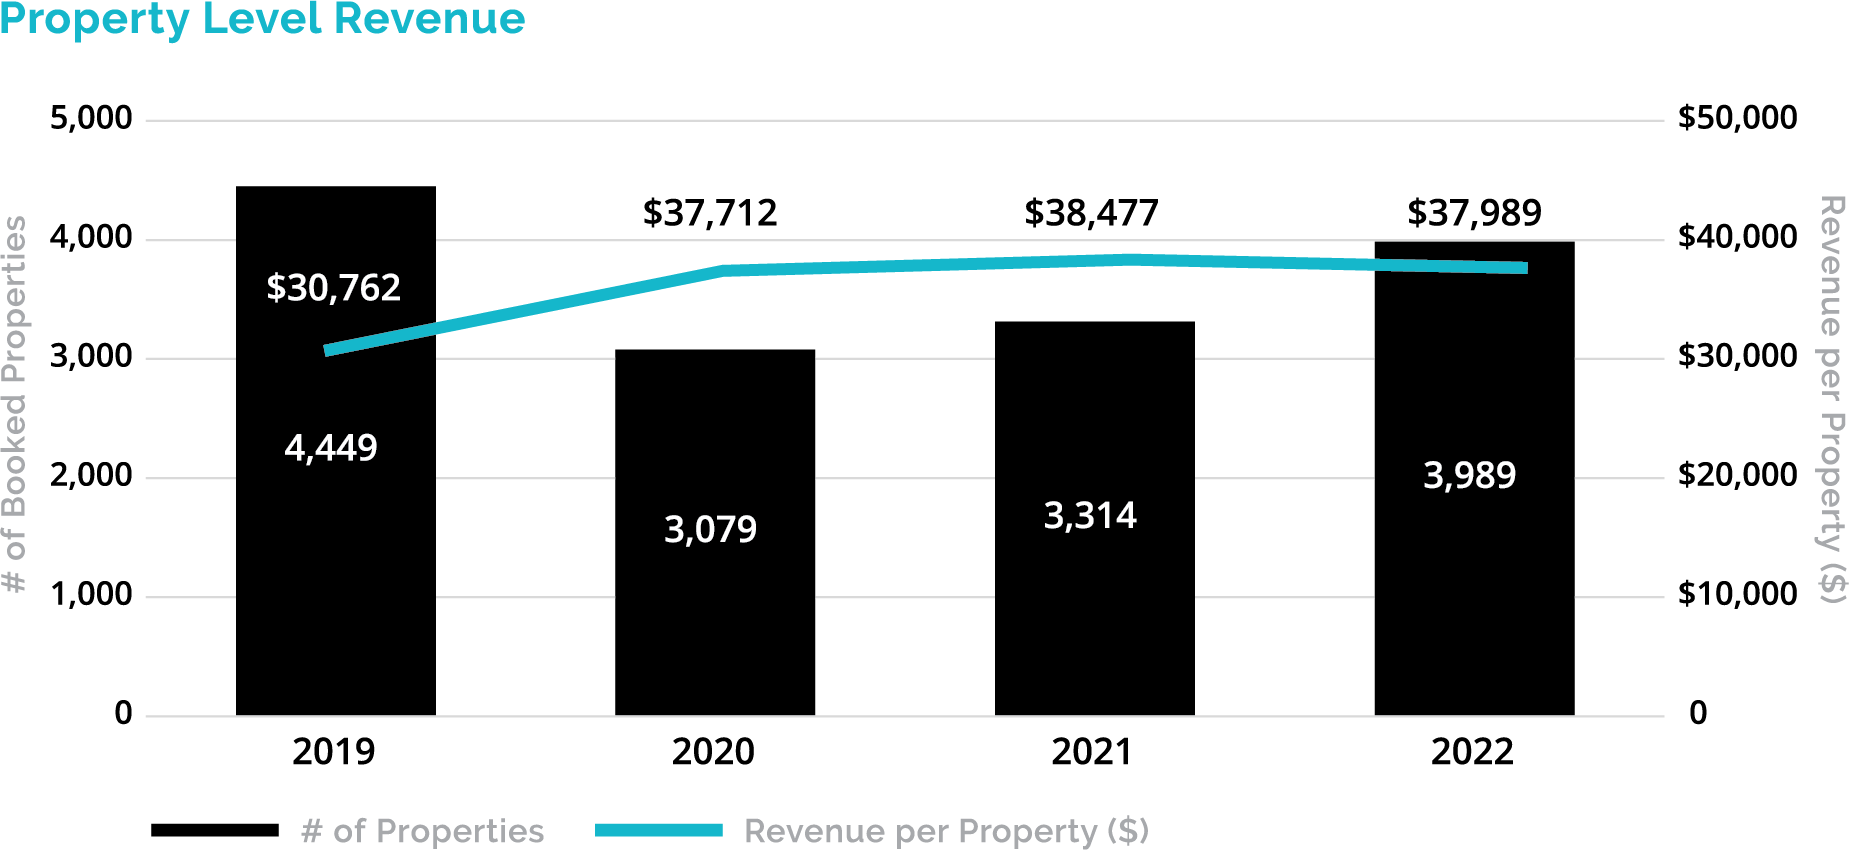
As COVID concerns subsided in 2022, many owners began to travel to other destinations and open availability in order to monetize their assets. The number of booked properties increased by 20.4% in 2022 compared to 2021 and increased almost 30% compared to 2020. This increase in inventory negatively impacted property-level performance; with supply continuing to grow into 2023, we suspect the average revenue per property to decrease sharply.
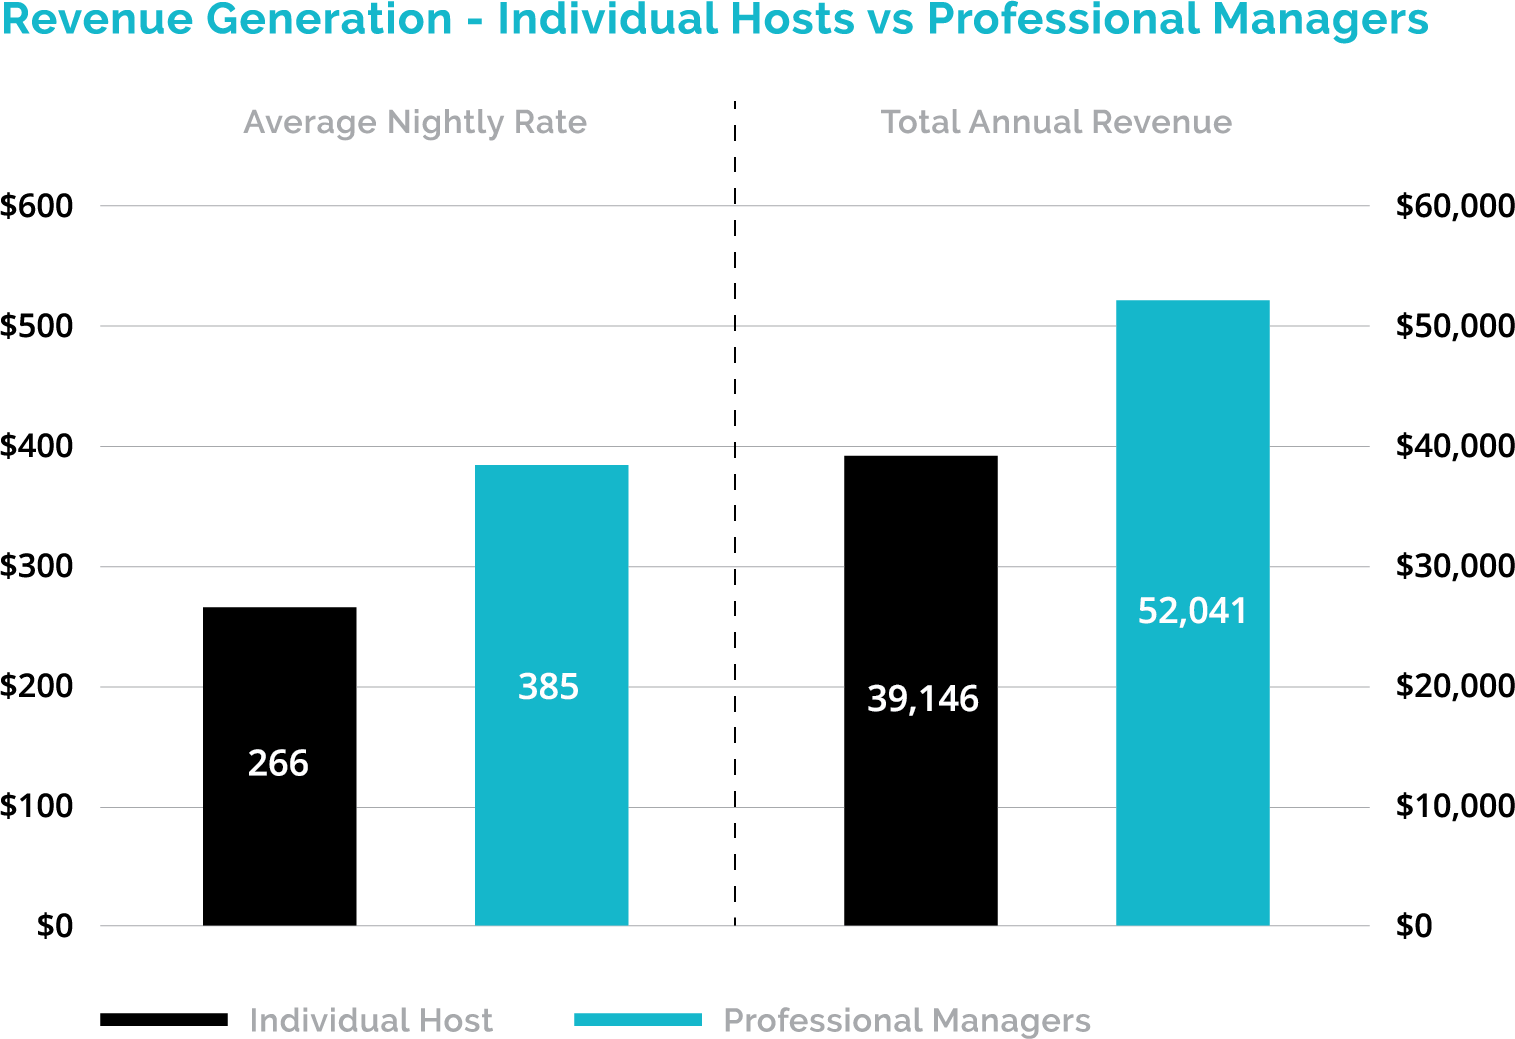
Owners can combat this rise in supply by engaging a professional management company. On average, professional managers earn 44.6% more on a nightly basis and generate 32.9% more annual revenue than individual hosts. Even with management fees, which typically amount to 30% (StayMarquis offers various options from 10% to 25%), owners who engage a professional management company can generate more revenue than if they are to do it alone. The table below shows performance of professional managers compared to individual hosts on the national level over the past 12 months. As economic uncertainty persists, professional managers are best suited to navigate the increasingly competitive environment
Source: How to Become an Airbnb Superhost: Meaning, Tips, Requirements
Forward Expectations
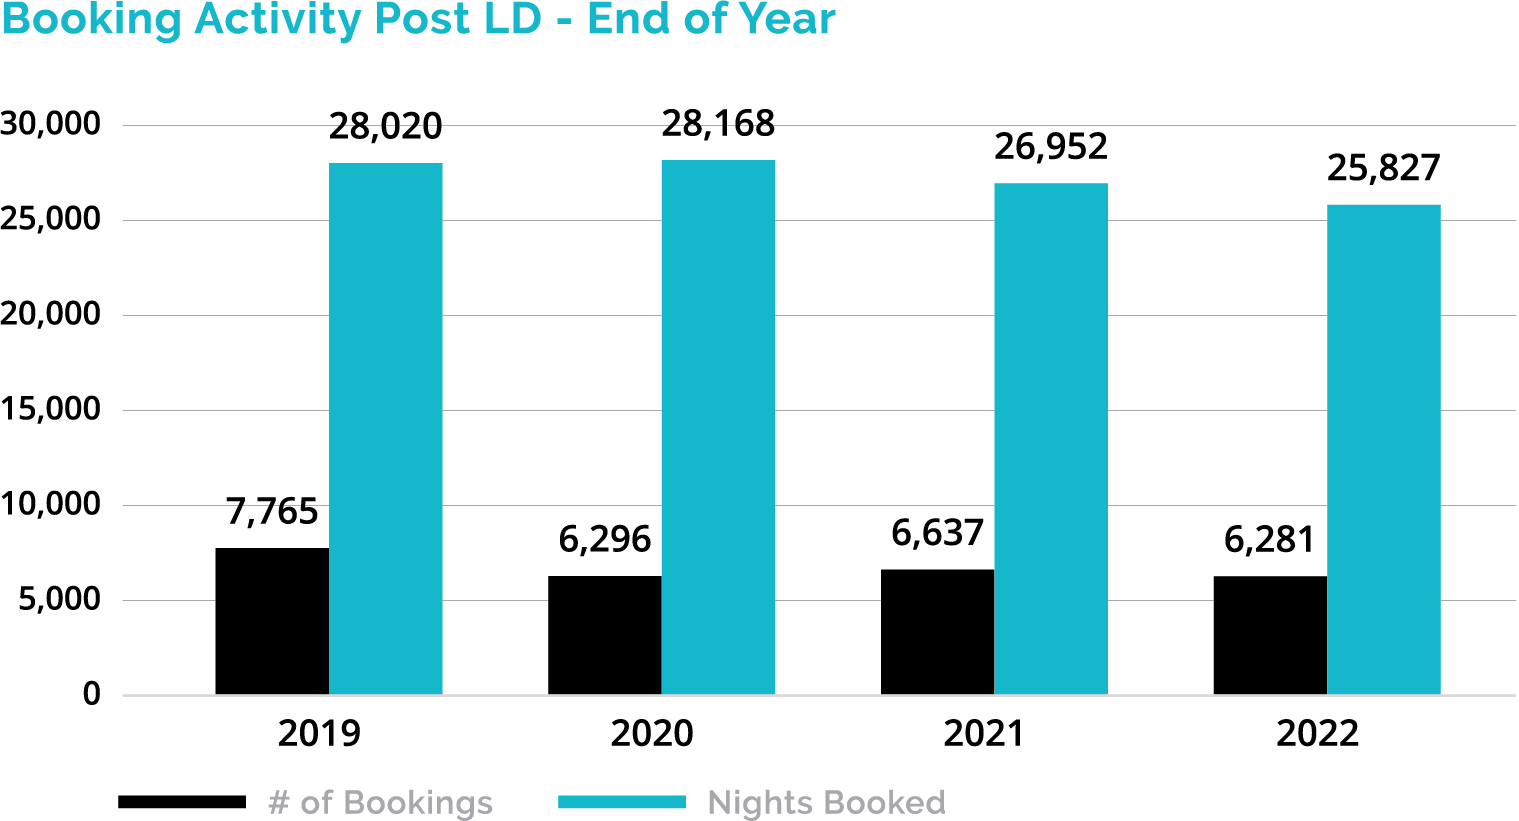
With the return to the office and the fully remote workstyle going somewhat 'out of style', the 2022 off-season was the slowest off-season in the past four years. Both the number of nights booked and the number of total bookings are approximately 5.0% lower than they were in 2021. Similar trends are expected for Q1 2023.
Heading into the 2023 peak season, owners must modify pricing to adjust to the shifting supply / demand dynamics. Unsurprisingly, the table below shows that rates tend to decrease as the amount of lead time decreases. The highest average nightly rates tend to be booked between two and four months of lead time. Owners should be conscious of their vacancies, and if their properties are still available two months before a check-in date, they should consider dropping rates.
| Avg Nightly Rate | ||||
|---|---|---|---|---|
| Lead Time | June | July | August | All Peak Months |
| Greater than 4 months | 1,137 | 1,312 | 1,314 | 1,272 |
| 3-4 months | 1,187 | 1,374 | 1,375 | 1,322 |
| 2-3 months | 1,193 | 1,378 | 1,320 | 1,304 |
| 1-2 months | 1,174 | 1,294 | 1,242 | 1,243 |
| Within 1 months | 1,066 | 1,334 | 1,348 | 1,267 |
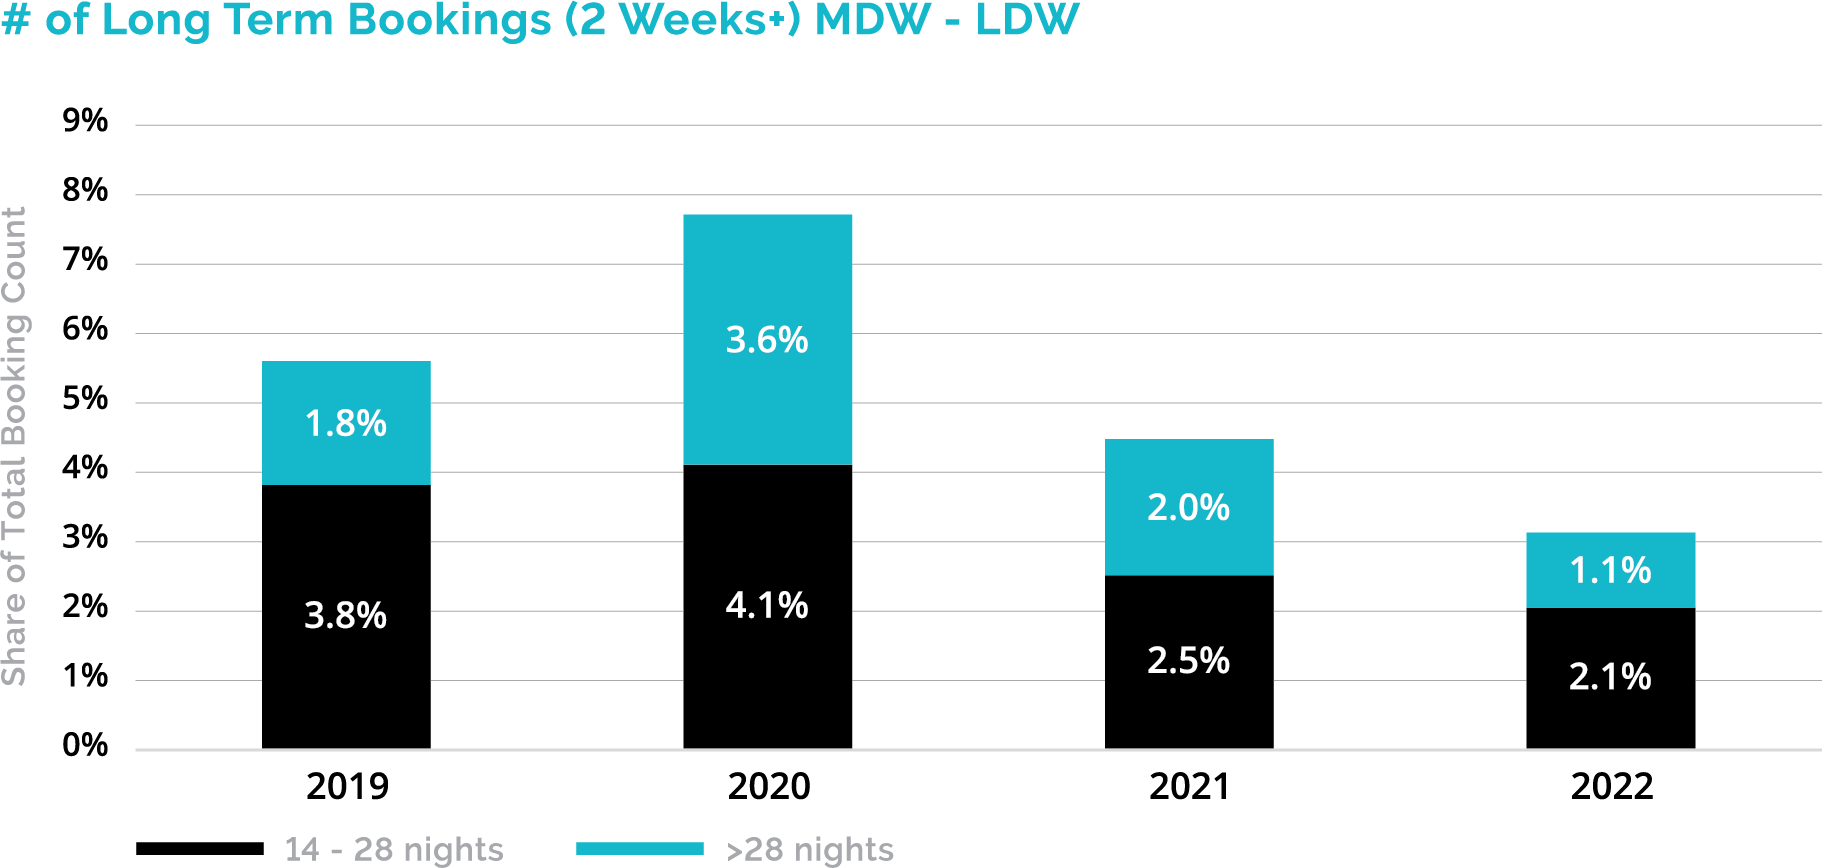
Further, longer term bookings (2 weeks+) are decreasing in demand. While there was an increase in bookings for longer term in 2020, mostly driven by COVID, these bookings have steadily decreased as a share of total booking activity over the past 2 years. Month long bookings represented 1.1% of all online bookings in 2022, the lowest in the last four years. Fear of a potential recession is expected to continue taking a toll on 2 week+ bookings as renters hold their wallets tighter and as seen this past year, will likely force renters to reduce the duration of their vacations instead of paying the high ticket amounts that owners are demanding. Given this stark drop-off, owners seeking long term bookings must use heavy discounts earlier in the year to offset
StayMarquis is a full-service vacation rental company that represents over 750 properties throughout Eastern Long Island, including the Hamptons, North Fork and Shelter Island. If you have a vacation rental property or are looking to purchase one, StayMarquis can help you with every aspect of the process from buying, preparing, renting and managing. Click here to learn more.
Max is the Chief Revenue Officer at StayMarquis and a rental pricing and strategy expert. In his role, Max oversees strategic advisory for 500+ properties across all markets that StayMarquis is active in, owns development and ongoing improvement of the patent pending StayMarquis Pricing Analytics Dashboard (PAD), and leads market research. Prior to joining StayMarquis, Max lived in the strategy consulting world, where he worked closely with chief executives across industries and geographies. He graduated from Emory University with degrees in Finance, Analytic Consulting, and Applied Mathematics.