Flash Update: 2023 Hamptons Rentals
2023 marks the first year where the impacts of COVID are no longer driving booking activity. Unsurprisingly, the continual changes in market dynamics have created challenges in optimizing listing strategy as we are seeing mixed signals across different performance indicators.
-
Renter demand remains strong...
Number of Bookings YTD (Jan 1 - May 15)
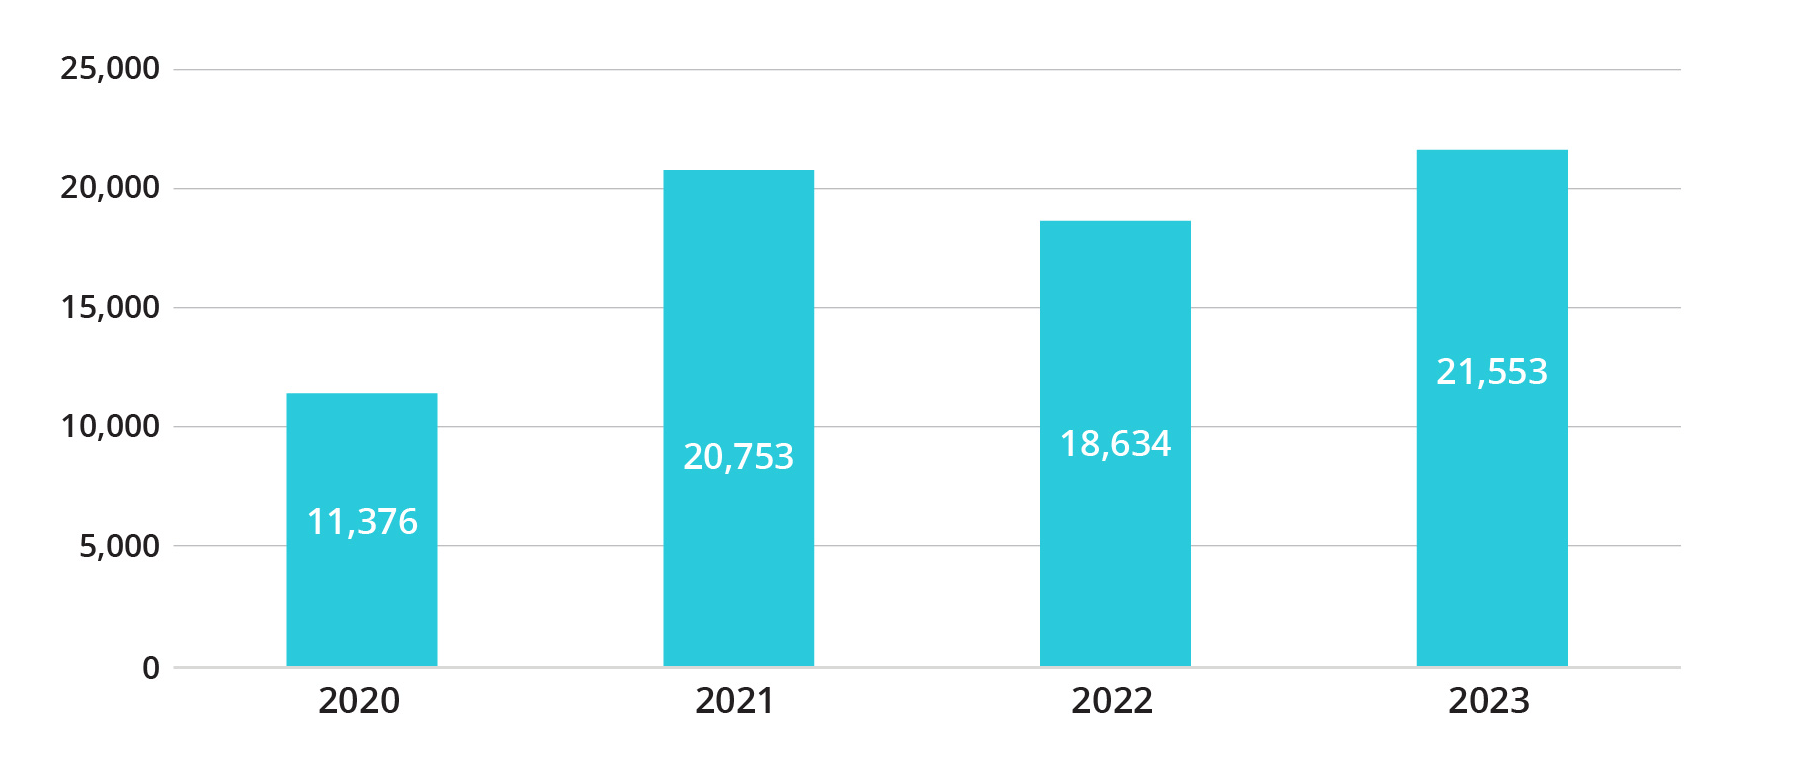
In 2023, there have been the most reservations made year-to-date in terms of quantity of bookings since 2020. This trend can be partially attributed to growth in supply. The number of available properties has continued to climb since 2021, a year where many listings were taken off market as properties changed ownership, owners used their own properties as COVID safe-havens, and owners who had recently purchased homes made improvements thus temporarily removing the property from the rental market. Interestingly, however, the number of booked properties has grown each year since 2020, including this year, and has outpaced the growth in available properties. This means that renters are “testing” new properties and loyalty to a specific home that they may have rented in the past is eroding. The number of booked properties as a percentage of available properties has risen from 41% in 2020 to 54% in 2023.
YoY Supply Changes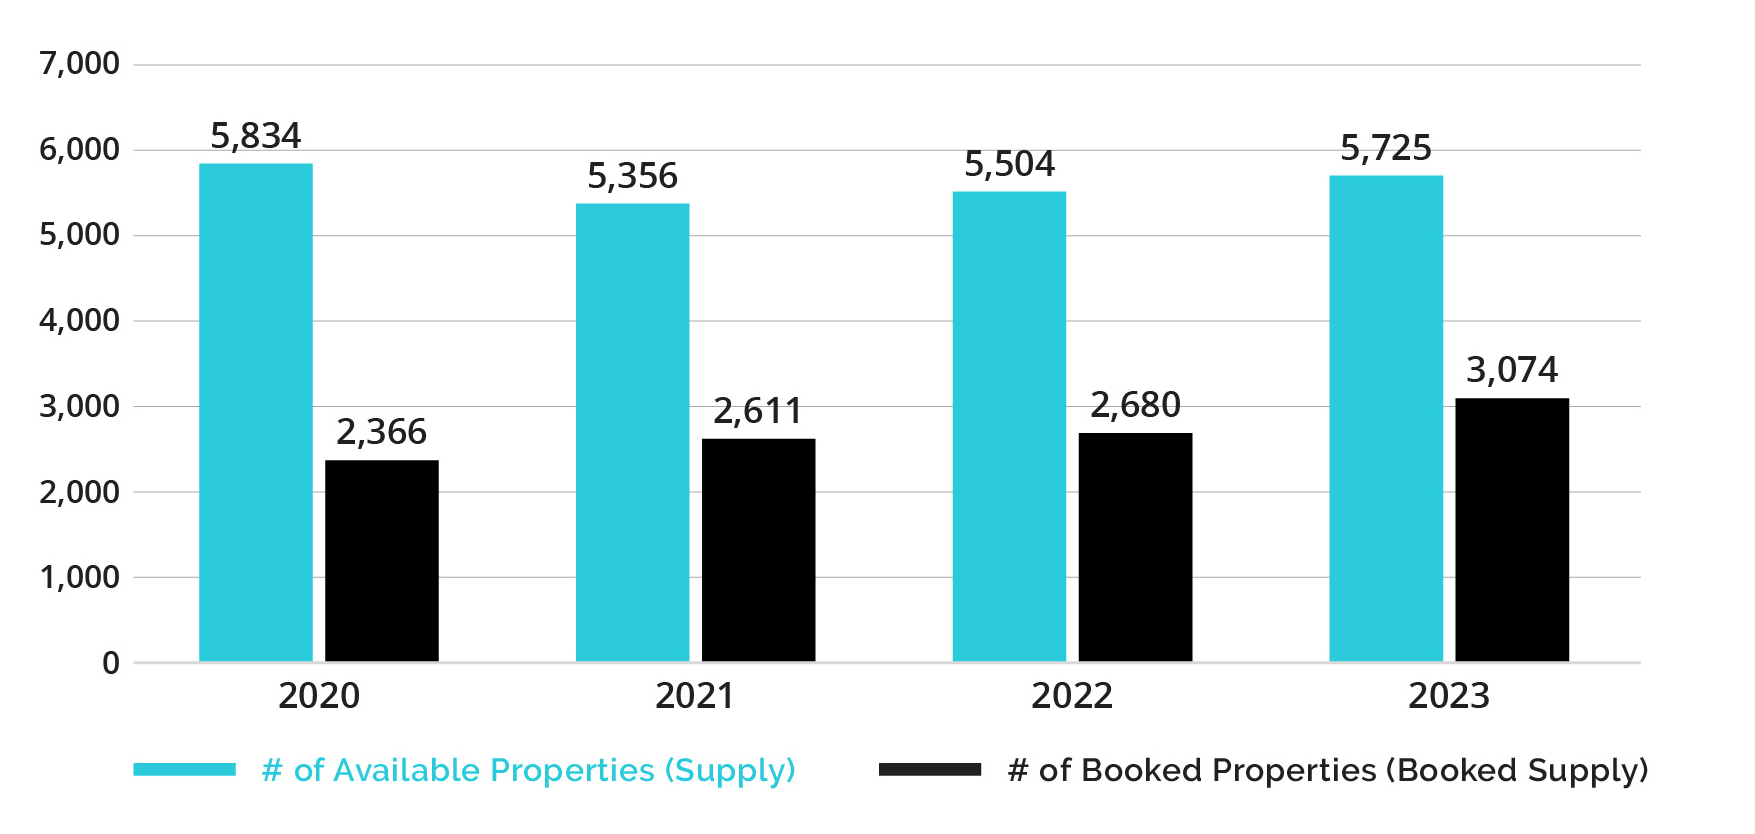
-
...yet pricing and revenue generated per property are falling.
YTD Revenue Performance 2020 2021 2022 2023 Revenue / Property $25,287 $42,603 $34,587 $25,852 Avg. Rate / Nt $815 $1,019 $1,080 $970 Revenue / Booking $5,259 $5,360 $4,974 $3,687 Each of the pricing-related key performance indicators has reverted toward, or are even below, pre-covid levels. Revenue per property has decreased precipitously to be roughly in line with 2020 levels due to the increases in the number of booked properties catching up to changes in total market Gross Booking Value. Both nightly rates and revenue per booking have fallen in 2023; revenue per booking is at a period low of $3,687 vs. a high of $5,360 in 2021 (-31%).
-
Biggest contributing factor: renters are reverting to shorter-term bookings.
YoY Changes in Booked Nights
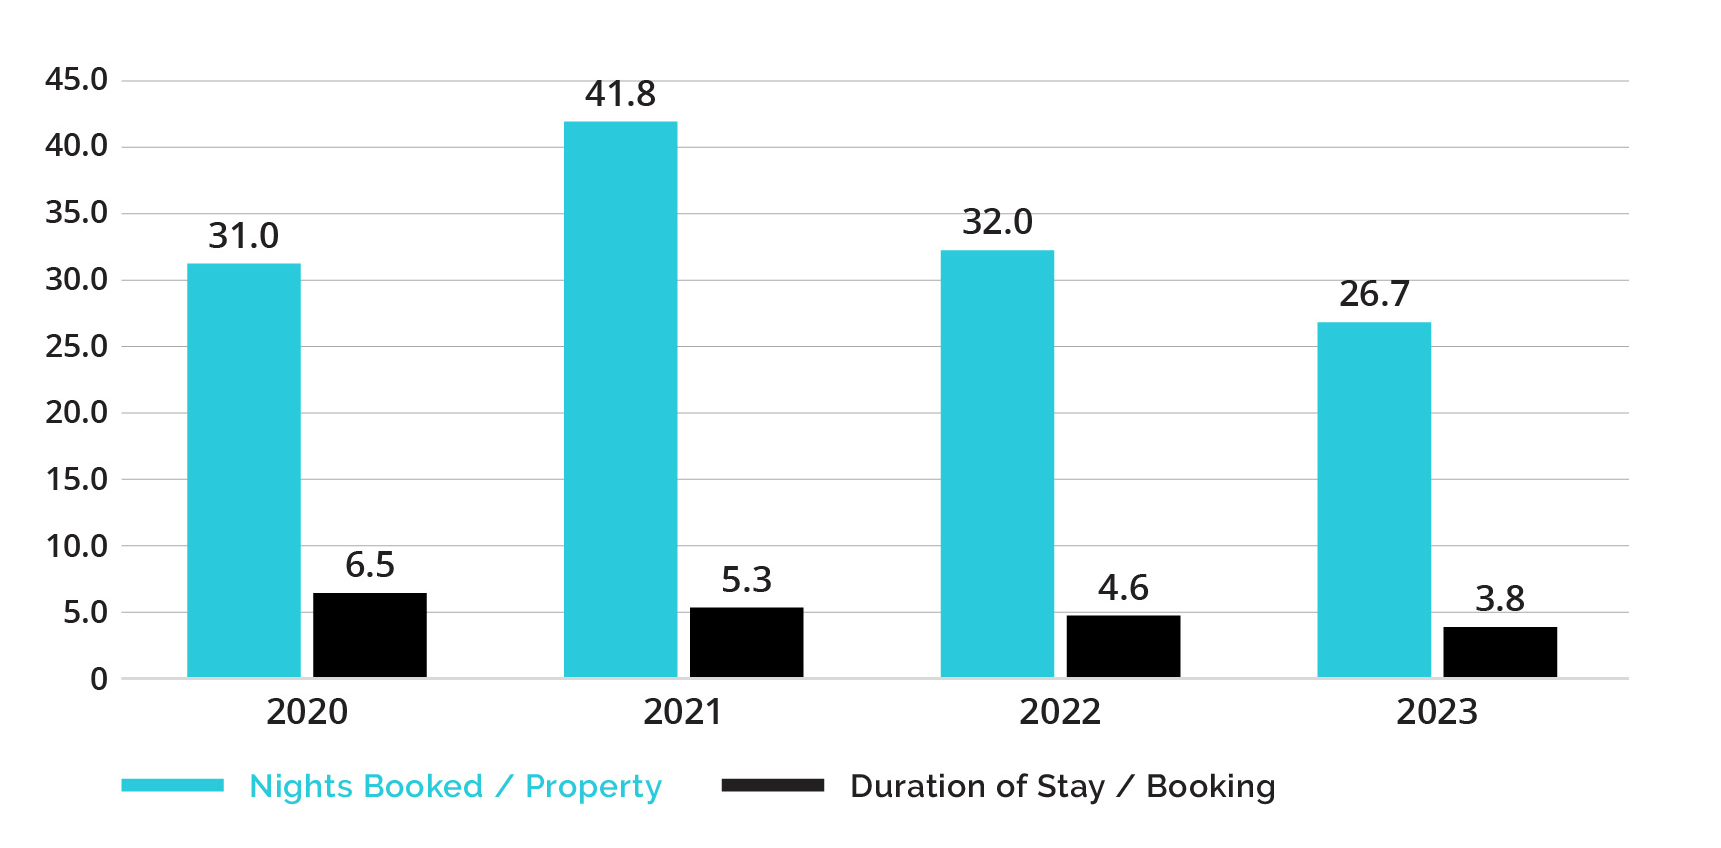
Outside of a spike in 2021, nights booked per property (from bookings made through May 15th of each year) has hovered around 30 nights per property. 2023 has shown the lowest level through May 15th at 26.7 nights booked per property. However, duration of stay has continued to decrease annually from 2020 to 2023 and is now under 4 nights per booking. Renter activity in 2023 has primarily been focused on week / long weekend / weekend bookings, marking a complete reversion to pre-pandemic activity levels.
*Sources: Airdna and internal data
About StayMarquis:
StayMarquis is a luxury vacation rental operator and asset manager with a managed portfolio of 750+ single-family homes throughout Eastern Long Island.
Founded in 2018, StayMarquis leverages its technology to provide premier marketing, booking, concierge, rental management and property management services.
StayMarquis prides itself on delivering a best-in-class vacation rental experience for homeowners and guests, alike.